Numerous locations in southeast Massachusetts and Rhode Island report over 30″
Feb 23, 2026
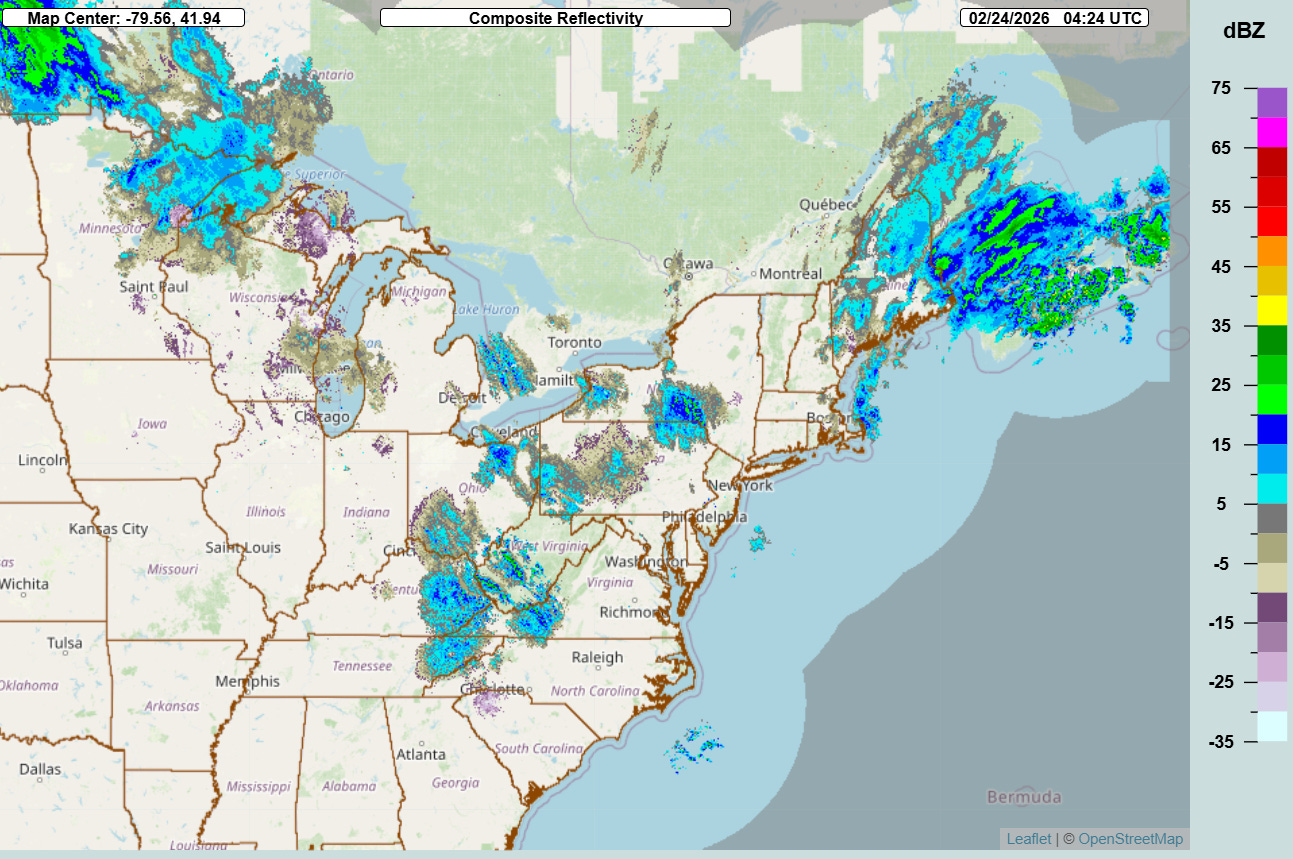
The radar mosaic late this evening was showing that the snow directly associated with the intense offshore low pressure area is rapidly winding down over the Northeast and now primarily affecting the Canadian Maritimes. Some lake effect snow showers and squalls are occurring downstream of the Great Lakes.
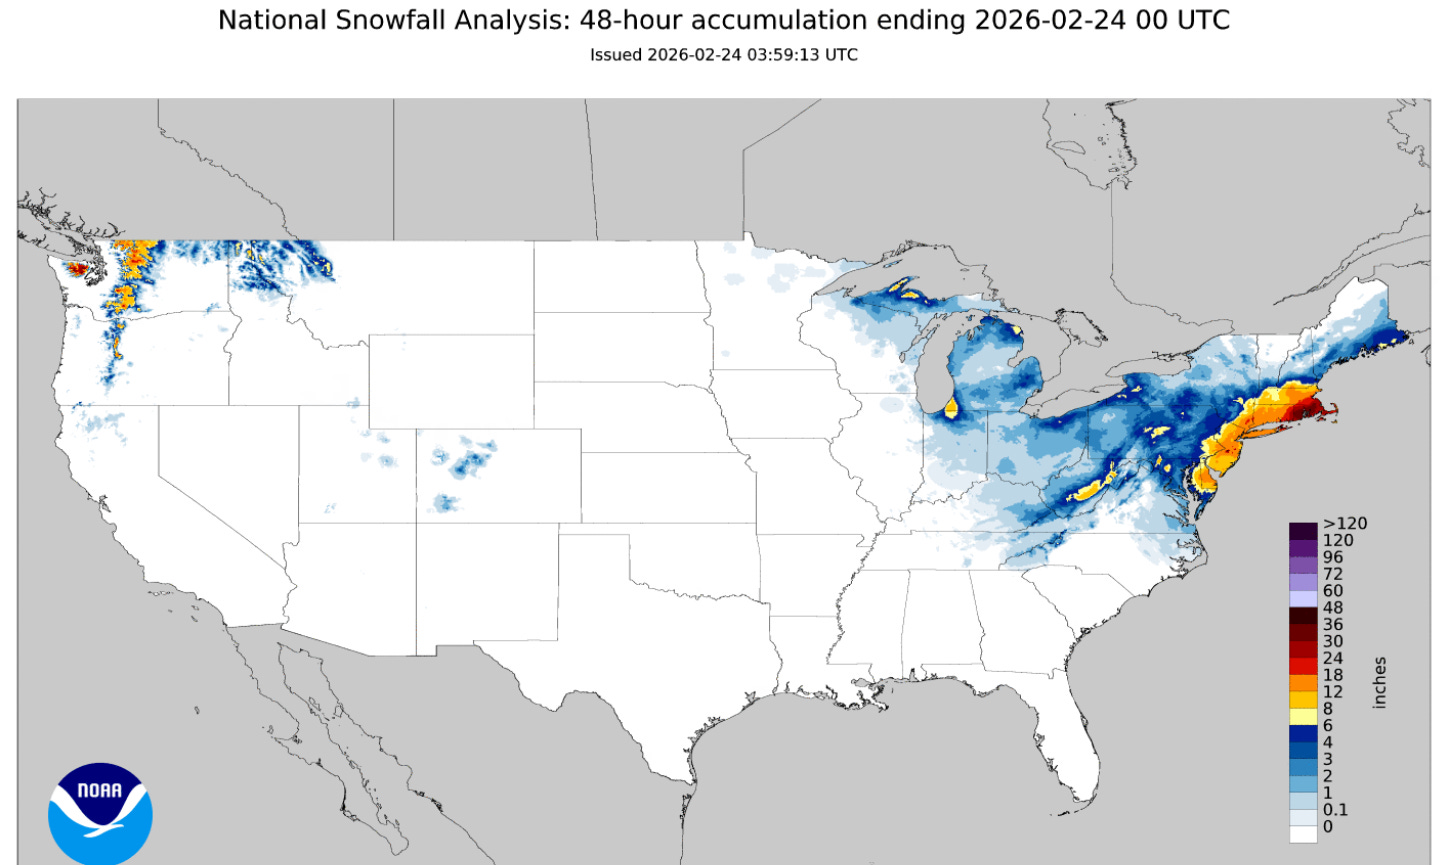
Now that the snow is winding down, we can start to get a full analysis of what transpired with this storm — and it is not any sort of an exaggeration to say that this was a historic blizzard for coastal regions from Delaware northeast through southern New England. The national 48-hour snowfall analysis from NOAA’s National Operational Hydrologic Remote Sensing Center (NOHRSC) shows how the heaviest snow with this event was focused primarily along and just inland from the coast, and became heavier as the storm intensified and moved northeast. Southeast New England was clearly ground zero as an intense band of snow pivoted around this area, resulting in many hours of intense snowfall with rates as high as 4-5” per hour.
Per the latest storm summary from the NWS Weather Prediction Center (WPC), a number of locations in Rhode Island and southeast Massachusetts reported 30+ inches of total snowfall from this event. The highest amount was at the official observing site at TF Green Airport in Providence, RI, with 37.9” of snow. WPC reports that this amount — if verified — would be an all-time state record 24-hour snowfall for Rhode Island. State records must be verified by the State Climate Extremes Committee before becoming final, official records.
35.5” of that snowfall in Providence fell on Monday, which shatters the previous daily record of 19” for Providence set on January 8, 1996. The prior state record snowfall appears to be 30” at Woonsocket during the Blizzard of 1978 — and several locations in the state look to have broken that record today.
I have to offer a mea culpa here, because in my one major post focused on the forecast for this event, I said that I thought that the NWS snowfall forecasts looked a “bit high.” I based that on an analysis of the models available late Saturday afternoon, a consensus of which seemed to me to support snowfall a tad under NWS forecasts (I also should know better than to pass any judgments on forecasts when I have not been able to fully engage in the lead-up to an event — lesson relearned). While a few spots did underperform a bit, obviously the hardest hit areas from New Jersey into southern New England saw snowfall that well exceeded both the model consensus and even the more aggressive (and more correct) NWS forecasts.

I will have more to say about the forecasts and meteorology for this historic event in future posts, but I wanted to take at least a cursory look at why this event may have been so insane with regard to snowfall. Something that quickly stood out to me was the available moisture. The above graphic is the observed precipitable water (PW) from 10 pm ET Sunday night. You can very clearly see an axis of moisture feeding up out of the Caribbean and southwest subtropical Atlantic into the circulation of the low pressure center off the Delmarva.
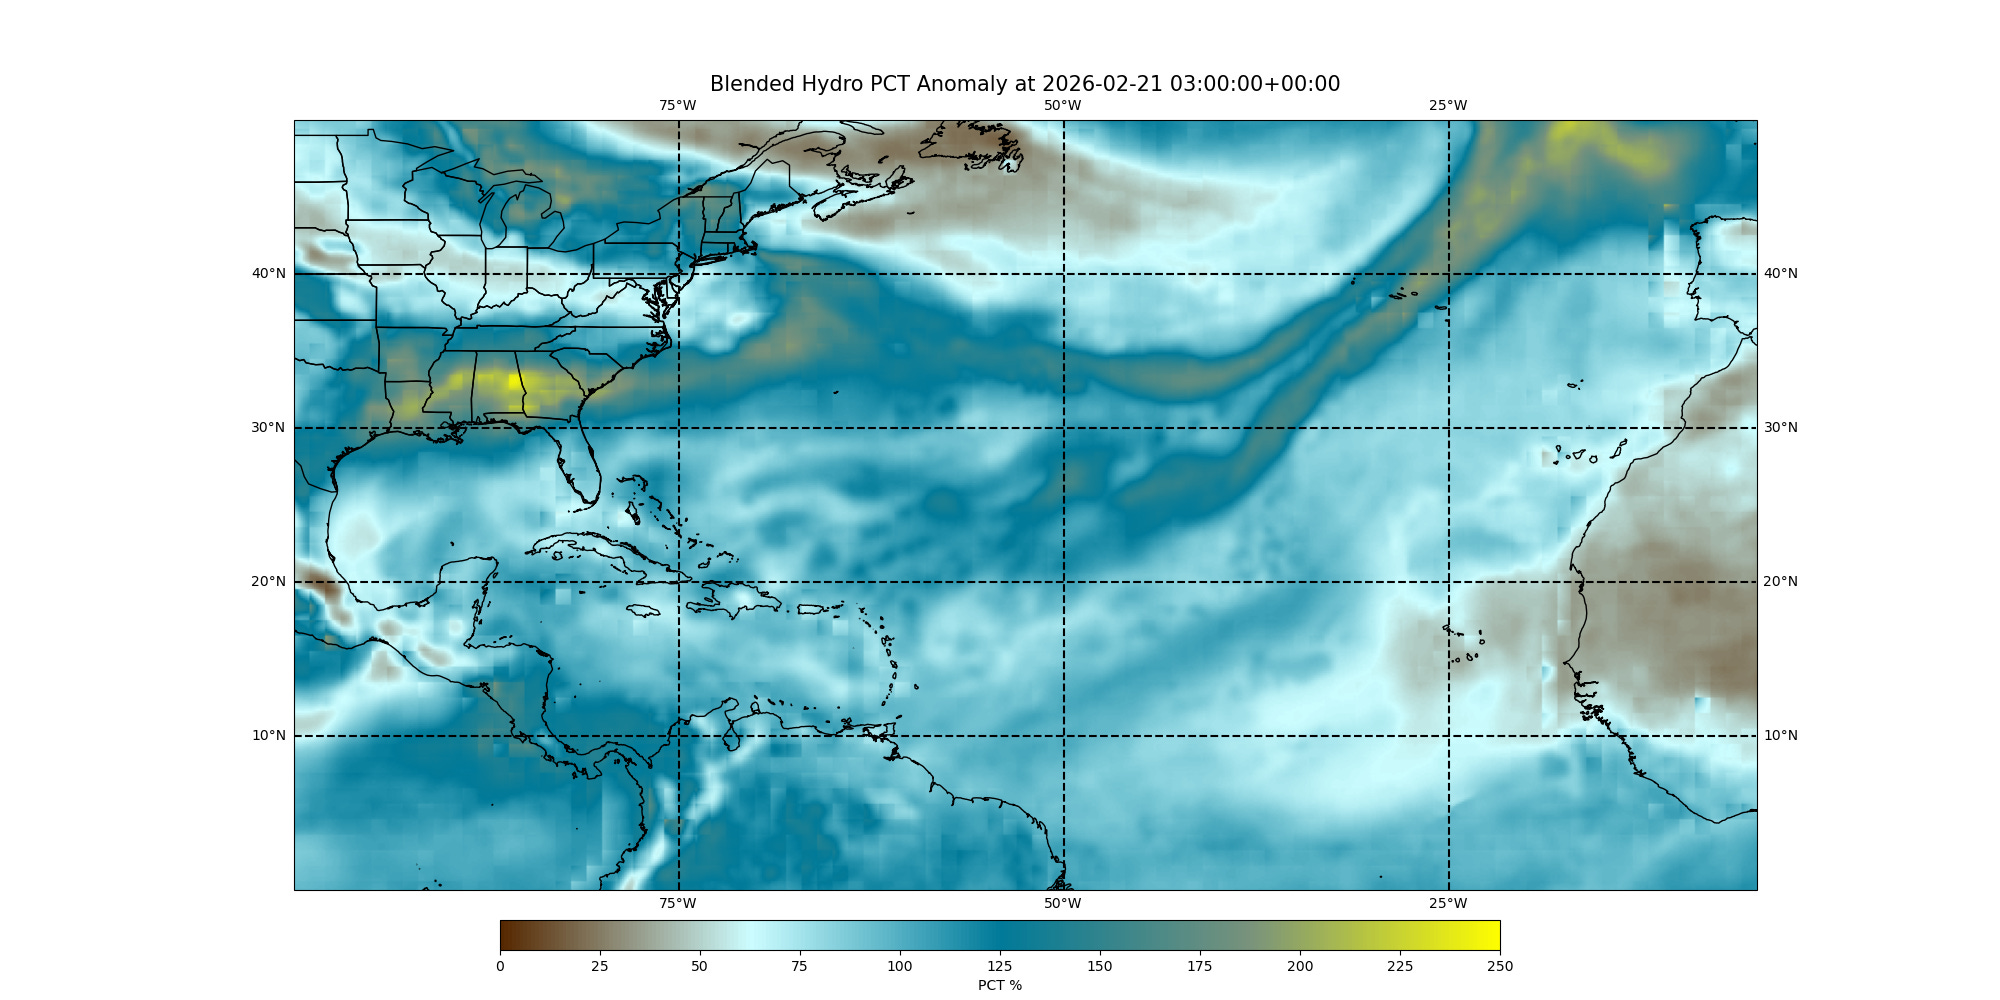
If we look at this same precipitable water product visualized as a comparison to normal values, we can see that this axis of moisture transport from the subtropics is providing precipitable water values of nearly 200% of normal into the region just off of Cape Cod. PW values of 200% of normal are the kind of values meteorologists would typically look for when diagnosing a flooding event — seeing them feeding into a heavy snow band is extremely impressive and suggests that this unusual moisture feed played an important role in why this snowfall was so extreme. Again, this is just based on an initial look at data — there will obviously be a tremendous amount of formal research on this event going forward.
Turning to wind, numerous locations along the coast had wind gusts of 60 mph or greater, again particularly across southeast New England as the storm system reached its maximum intensity. The highest recorded gust per WPC was 84 mph at Montauk Point on Long Island.

Power outages have also been maximized across southeast New England, with the PowerOutage.us map showing the Cape Cod region particularly hard hit. About 400,000 customers remain without power tonight due to the blizzard — over 250K of these are in Massachusetts.

Leave a comment