Analyzing how it developed and evolved, and contextualizing the models’ struggles with the forecast
Feb 25, 2026
The historic blizzard that impacted the coastal Mid-Atlantic and Northeast regions earlier this week will be remembered by the people impacted for a long time. Given the incredible snowfall that set numerous records and that the forecast for the event was particularly challenging, I wanted to spend some time taking a closer look at the meteorology of the event. Fair warning that I went a little deeper into science than I normally do — for that reason, I have opened up the comments to everyone, and hope folks will ask any questions they might have.
This is a 36 hour mid-level water vapor satellite loop from GOES-East through about 5 pm ET Monday. By looking at this channel of the satellite imagery, meteorologists can see what is happening in the middle and upper levels of the atmosphere. As I discussed in my post Sunday evening, intense extratropical cyclones such as this one result from a strong middle and upper level disturbance interacting with a strong temperature gradient at the surface. This satellite loop shows the evolution from the upper level disturbance “digging” southeast across the Mid-Atlantic states Sunday morning to the development and intensification of the low pressure system which by the end of the loop is approaching Nova Scotia.
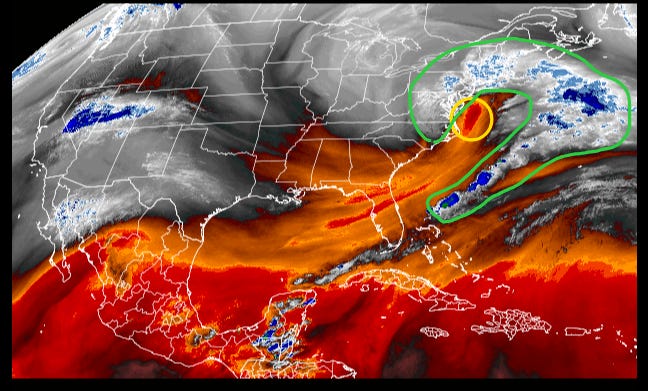
This image from about 6 pm ET Sunday is particularly revealing. You can see the deep red colors off the Delmarva (yellow circle), which shows the location of very dry, sinking air at the leading edge of the upper level disturbance.
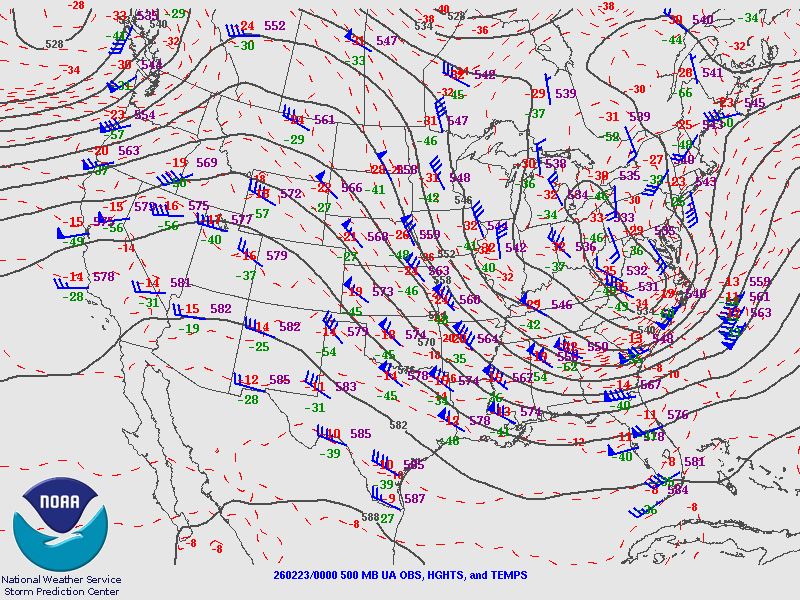
A traditional weather map at 500 millibars — about 18,000 ft AGL — shows this disturbance as well, with very cold temperatures (-34C) over central North Carolina and strong winds (120 knots at Charleston, SC) associated with the disturbance.

A few hours later, the low pressure system at the surface is clearly taking shape as the atmospheric forcing provided by this disturbance interacts with the Gulfstream enhanced temperature gradient, all shown in this NWS automated surface analysis from 9 pm ET. One can also see in the 6 pm ET water vapor satellite imagery above the clear comma shape of the moisture field surrounding the upper level disturbance, also indicative of the intensifying low pressure system.
In just about 15 hours the system would go from that initial development phase to this incredibly intense, tightly wound cyclone southeast of Cape Cod that can be seen in visible satellite imagery from Monday afternoon. The low pressure system deepened about 24 millibars in that time period, well in excess of what is needed to be classified as a “bomb cyclone.”
If we look at the resulting precipitation evolution using a similar 36-hour loop of mosaicked radar reflectivity from the NSSL Multi-radar Multi-Sensor System (MRMS), one can clearly see how the heavy snow impacted the coast and areas just inland. You can also see that the moderate to heavy snow was most prolonged over southeast New England, and also the heaviest snow with 35+ dBZ (yellow colors) was over Rhode Island and southeast Massachusetts. These values of reflectivity are indicative of extremely heavy snowfall.
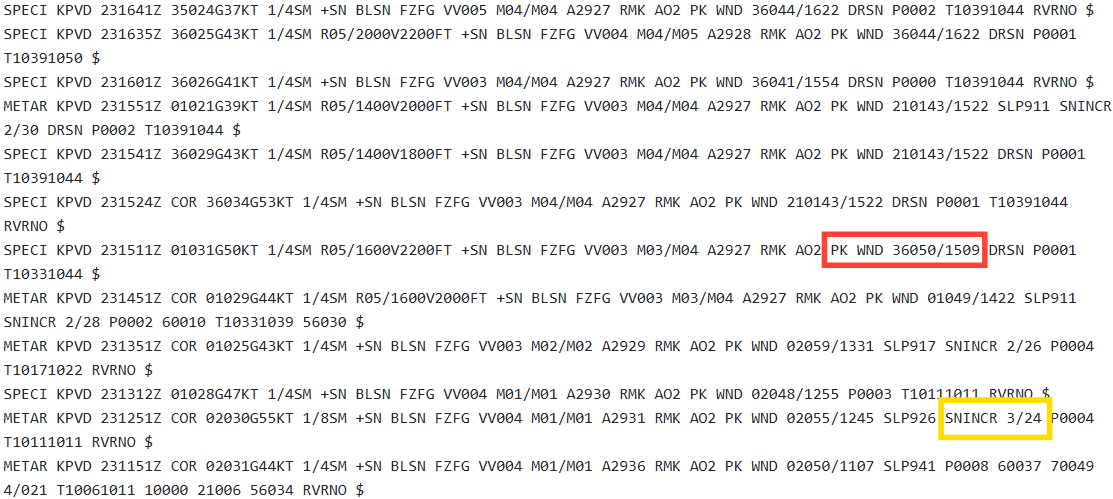
The observations Monday morning from T.F. Green Airport near Providence when that high reflectivity was over the airport are some of the most impressive I have seen during a blizzard east of the Rockies. The raw coded observations are above starting from the bottom at 1151 UTC (6:51 am ET) up to 1641 UTC (11:41 am ET) at the top. I do not expect non-meteorologists to interpret these, obviously, but I want to highlight two key remarks in the observations.
The first I have highlighted in yellow is the “SNINCR” remark. SNINCR stands for “snow increase,” and this remark on a weather observation shows that the snow depth at the observation site has increased by at least an inch in the last hour. The remark I have highlighted on the 1251 UTC (7:51 am ET) observation has the numbers “3/24” which means 3” of snow in the last hour and the snow depth on the ground at the site is 24”. Seeing a SNINCR remark for an inch of new snow on an hourly observation is impressive — seeing multiple hours of two or more inches (one ob not shown had a snow increase of 4” in an hour) is truly insane.
The other remark is the “PK WND” remark, which shows the direction, speed and time of the strongest wind gust since the last hourly observation. The PK WND remark I have highlighted in red shows a peak wind of 50 knots (58 mph) from the north (360 degrees) at 1509 UTC (10:09 am ET). 50 knots is the threshold for defining a severe thunderstorm — to see this strong of a wind gust during a blizzard at an observing site on land is truly impressive. You can see in the observations that Providence was frequently gusting greater than 45 knots (52 mph), well in excess of the blizzard threshold of 35 mph. The peak gust during this period was 59 knots (68 mph).
Given the historic nature of this storm, there has been some angst in the media about the forecast leading up to this event, as a major blizzard for the impacted areas was not really explicitly first forecast until sometime Saturday. I have seen a fair amount of social media traffic advertising the forecast for this system as a “win” for the US Global Forecast System (GFS) model, the NOAA global model that showed a potential blizzard for the Mid-Atlantic starting about the middle of last week. This was in contrast to the European Center for Medium Range Weather Forecast (ECMWF or European) system that showed any surface low pressure system moving more out to sea with limited impact on the East Coast.
This characterization of the “model wars” makes me uncomfortable for a variety of reasons. First, the GFS model has been on its own with being more aggressive with a potential East Coast snowstorm multiple times over this winter and was incorrect. I equate this situation with a similar type of “false alarm” problem the GFS has with showing “phantom” tropical systems in the Caribbean, particularly early and late in the hurricane season. Most of the time when the GFS shows one of these systems, it is wrong — but occasionally, a system does indeed develop as advertised by the GFS.
In my own forecasting, when I see the GFS out on its own showing a system like an East Coast low or a Caribbean tropical storm, I look at it from an ensemble or probabilistic sense. In other words, my thought process is that there is at least some part of the atmospheric setup that favors an evolution like the GFS is showing — but given its track record, the actual atmosphere is unlikely to fully evolve in the manner needed to support the development the GFS shows. However, unlikely is not the same as “100% for sure not going to happen.” Occasionally the other needed pieces of atmospheric evolution fall in a way to support the development the GFS shows, which is why in my post on Wednesday I said:
An additional upper level weather disturbance is expected to drop southeast along the East Coast early next week, resulting in the development of an intense low pressure storm system over the Western Atlantic. Most of the models right now suggest this development will occur far enough to the east to result in just some light to moderate snow potential across the Mid-Atlantic with it. However, the US Global Forecast System model and some ensemble members suggest a more impactful snowfall, so obviously given this is still several days away, we will need to keep an eye on it. (emphasis added)
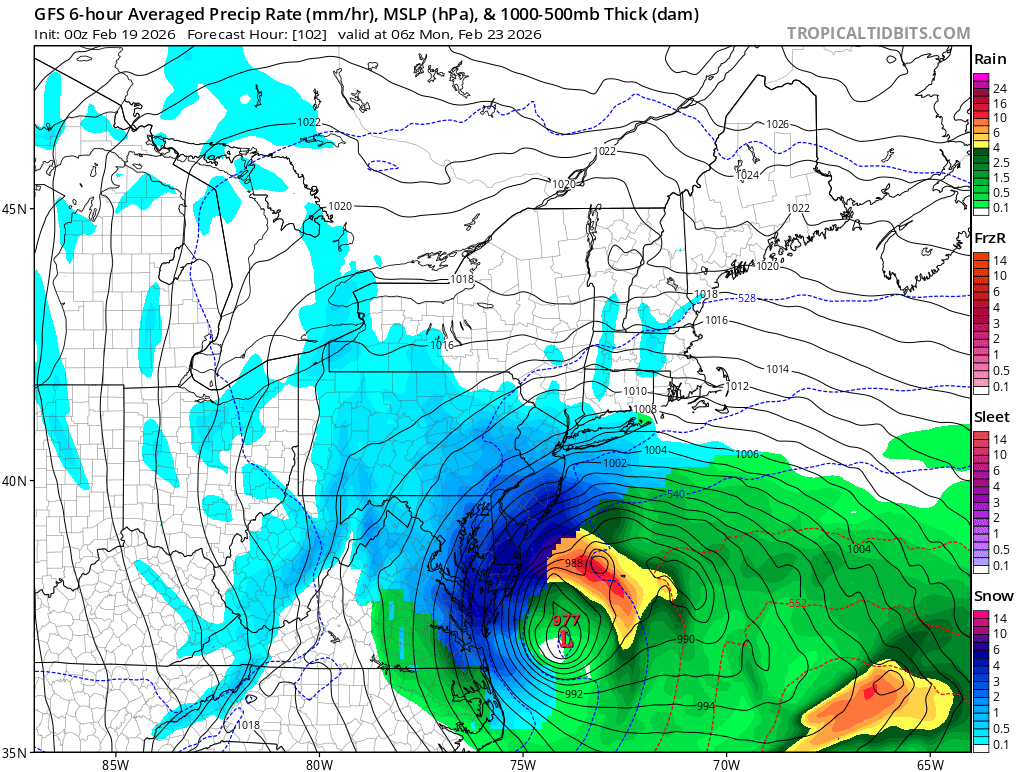
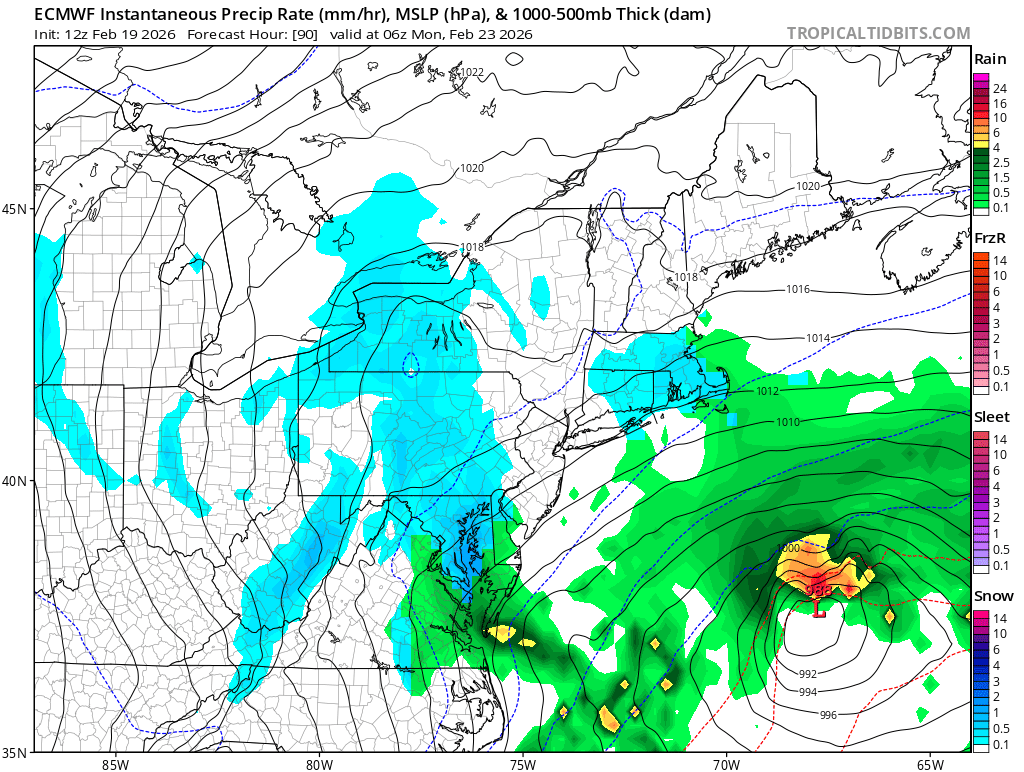
On the next model forecast cycle (Thursday 0000 UTC) after I wrote that, the GFS continued to show a rapidly intensifying low pressure system off the Delmarva by Sunday night, or in about four days.
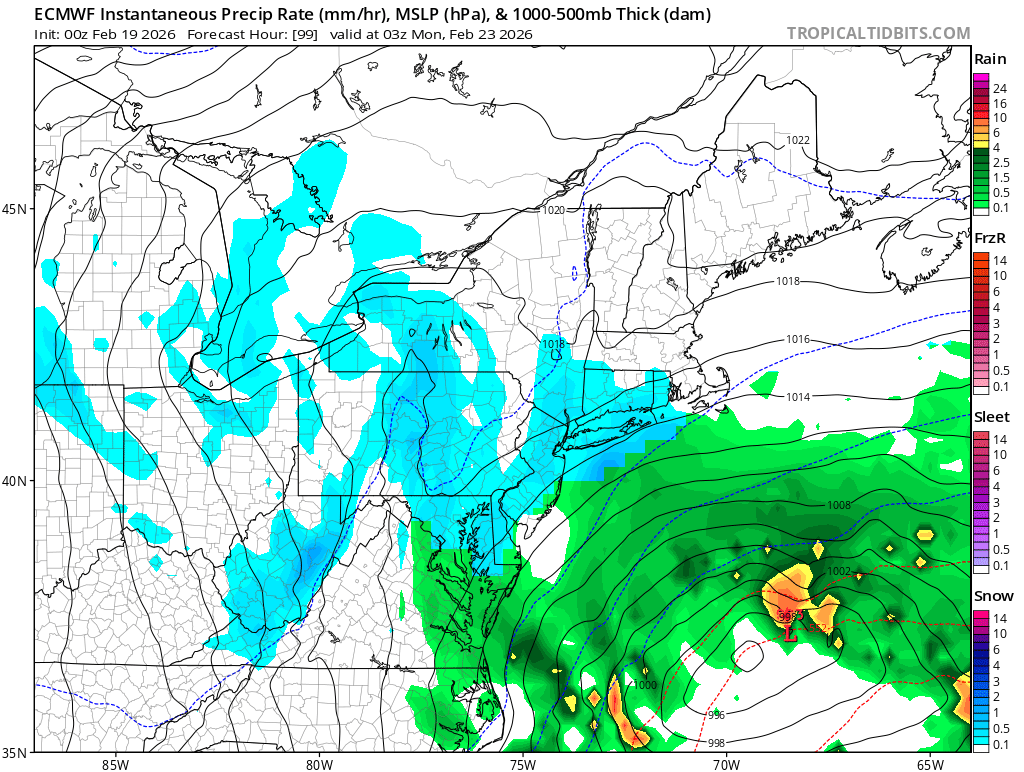
This was undoubtedly in hindsight a much better forecast than the operational ECMWF model (above) which showed a weaker system developing farther to the east for this forecast cycle.
However, the actual snowfall forecast from this run of the GFS was still well short of what actually transpired.
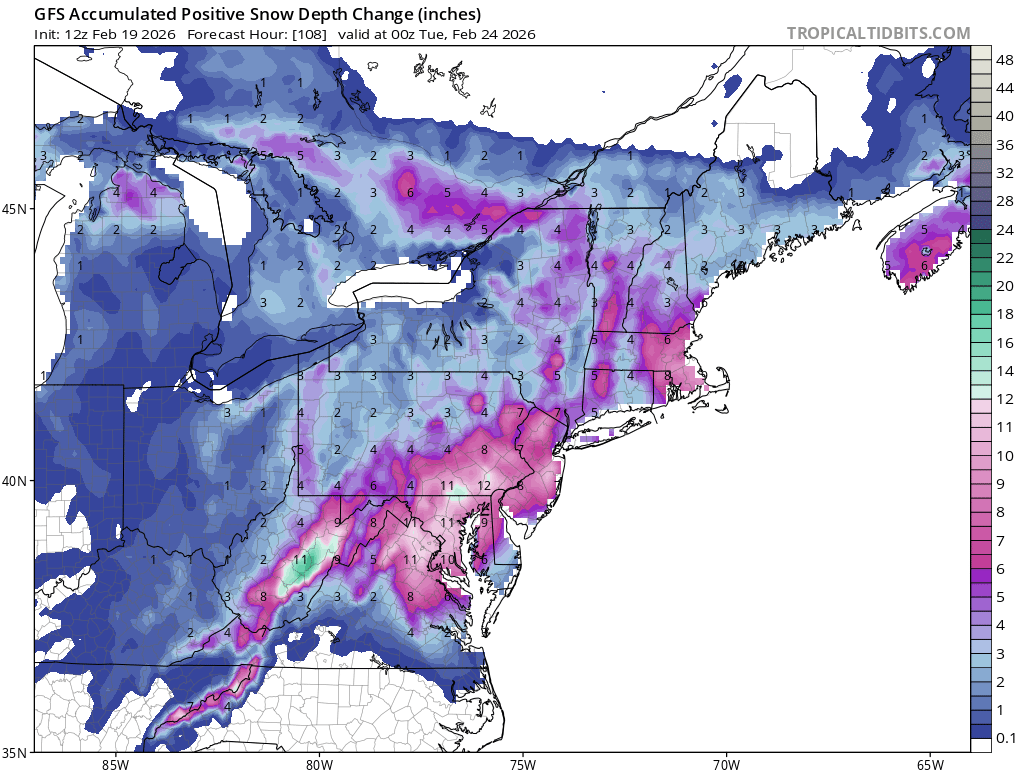
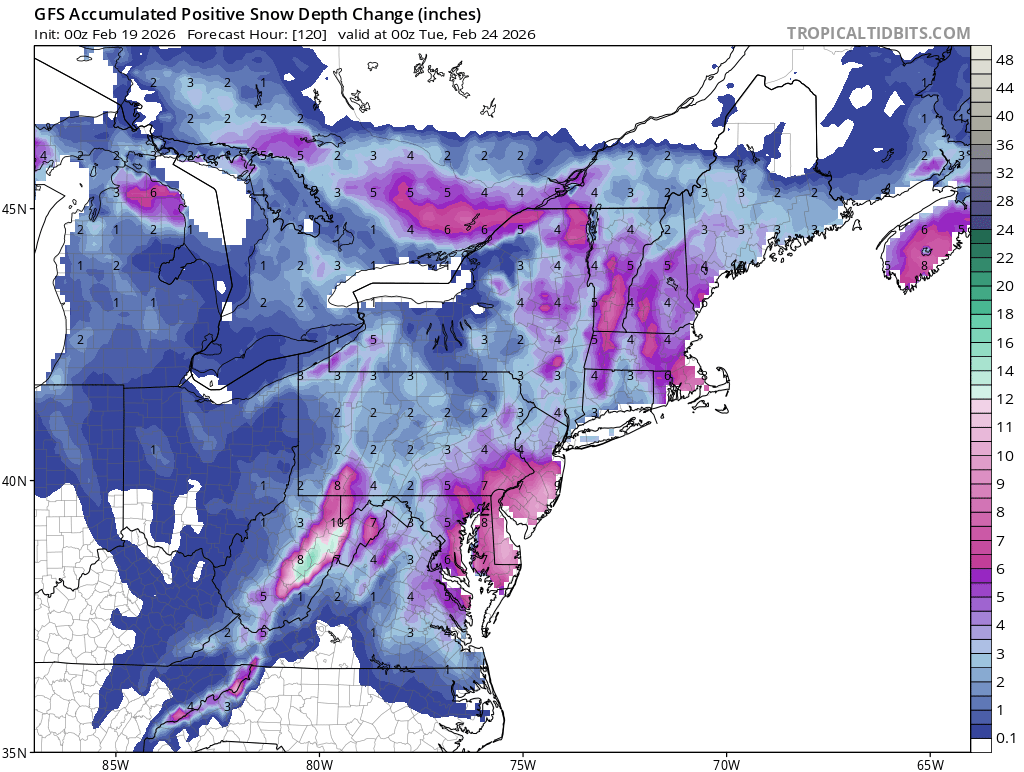
Meanwhile, on the next main model cycle Thursday morning, the GFS had nearly a foot of snow falling across the the DC metro area and points well to the west — which obviously did not materialize.
The cycle of the ECMWF from Thursday morning started to show a trend in the forecast for the surface low to be a bit stronger and closer to the coast.
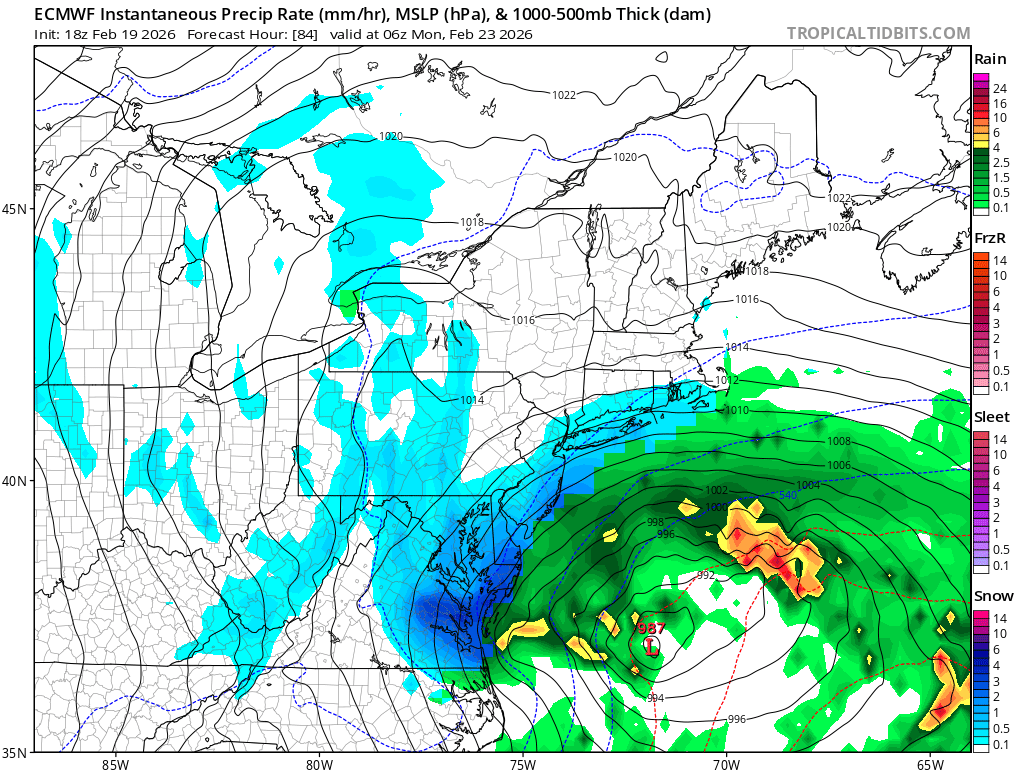
The next forecast cycle of the ECMWF just 6 hours later made a major jump to the west with a stronger system. By Friday, all of the models had the basic idea of a more intense, closer to the coast low pressure system that would bring impactful snow and wind to the Mid-Atlantic and Northeast coast. However, the details as far as intensity and precipitation amounts varied between models and between each cycle of the models. These sorts of model variations are typical — although they were likely a bit more pronounced than normal with this system.
I have referred a few different times to the “operational” run of the GFS or ECMWF, and this is a good time to explain what I mean by that term. The “operational” version of a model is the model that is run with the optimal assimilation of observational data, and at least in theory should provide the “best” (i.e., most accurate) forecast that one would want to use if making a deterministic forecast for a given time period. Obviously, though, the atmosphere is a very complex system that we cannot ever perfectly observe, which is why we have ensemble models where we perturb that initial condition dozens of times and rerun the model to try to capture the uncertainty. Ensemble systems enable us to have probabilistic forecasts that can provide more useful forecast information for decision making.
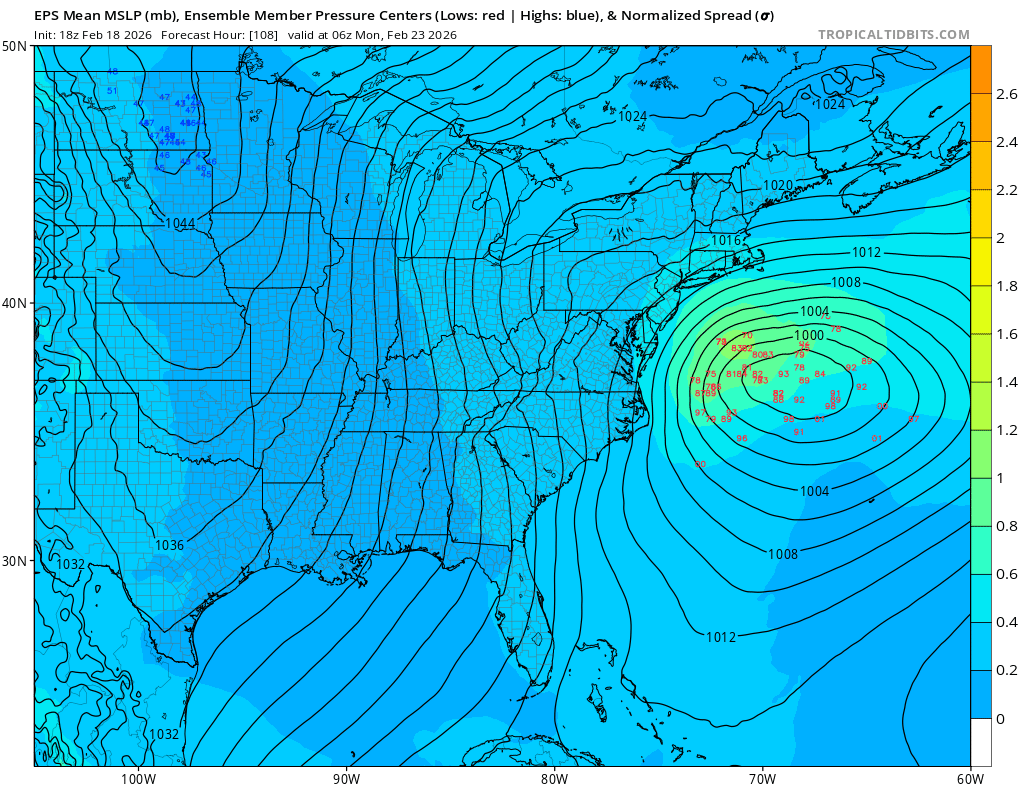
This graphic shows the European ensemble forecast from Wednesday afternoon when I wrote the blurb I quoted above from my Wednesday post. The contours show the mean of the 50 ensemble members’ surface pressure forecasts. The red numbers show the individual locations of low pressure centers from each ensemble member — i.e., the “78” you can see at the northwest edge of the cluster of numbers means that one of the ensemble members has a 978 millibar low centered at that location. The image is the “normalized spread,” i.e., where the spread is higher there is greater uncertainty. Hence, you can see that while the operational ECMWF was well offshore with a weaker surface low, the ECMWF ensemble had a number of members with a much more intense low closer to the coast, and the spread clearly highlighted the area off the Delmarva as an area with significant forecast uncertainty.
When I first started in meteorology, we had three deterministic models to look at that were of very poor resolution. Two of those models no longer exist — the third was an early version of what would eventually become the GFS model. Soon after I started off as a meteorologist, some limited products began to become available from the ECMWF. Nearly forty years later, there are literally thousands of high resolution global and regional model forecasts generated every day — and with the impending revolution that I think artificial intelligence is about to bring, those numbers will likely increase by an order of magnitude soon. This is why the “model wars” in which people compare the operational GFS and ECMWF solutions for Nor’easters or hurricanes — and that first really became a thing in the media after the ECMWF did such a good job of handling the unusual track of Hurricane Sandy (“the Euro nailed Sandy” is literally a meme now in the weather world) — will soon become a thing of the past.
The bottom line is that while a particular modeling system may handle a given weather situation best (e.g., there have been hurricanes that the German ICON model has for whatever reason handled better than the other models), if you really want to know what modeling system is “best” you have to look at actual verification statistics over months or years. These statistics used to be relatively easy to find on NOAA or other global modeling centers or academic sites, but for whatever reason have become harder and harder to find in recent years.
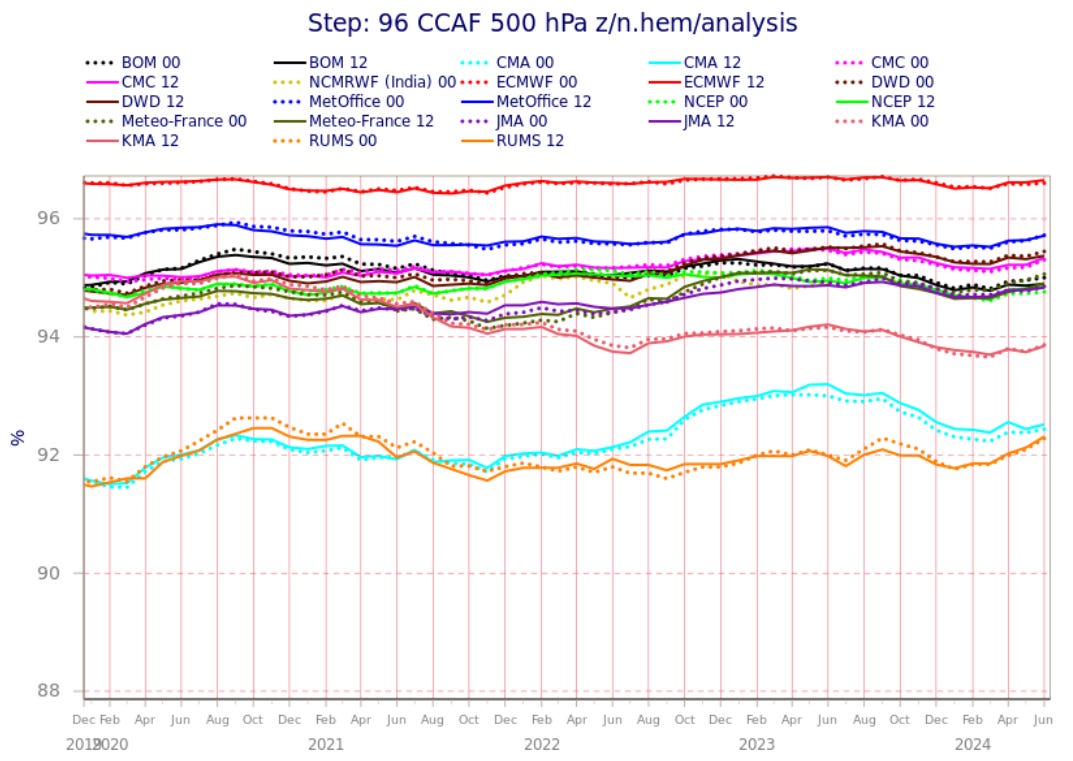
However, all the statistics and papers I have seen in recent years have shown that the ECMWF remains far and away the best model, i.e., it has the most accurate forecasts of parameters such as 500 millibar heights, surface pressure, and precipitation over a long period of time. The graphic above I found on the interwebs shows stats for the four years leading up to mid 2024 for global model 500 millibar verification at 96 hour forecast lead time. As far as I am aware, this is pretty much still where things stand: ECMWF best, UK Met Office next but significantly lower, and then the US GFS, Canadian, German and Japanese models in a group with similar skill scores.
While the incredible magnitude of this historic blizzard may not have been fully anticipated or forecast with as much lead time as typical, using an ensemble approach meteorologists were able to alert the public that a major blizzard was likely to impact the coastal Mid-Atlantic and Northeast with sufficient lead time for major societal preparations to be made. Winter storm watches were issued by the NWS for the most heavily impacted areas by Friday afternoon, and blizzard warnings followed about 24 hours later for most areas. Obviously, we as meteorologists would prefer to have more lead time than this, but as CNN weather journalist Andrew Freedman said:
Rapidly changing forecasts present unique challenges for forecasters, weather communicators and public officials alike. Instead of having several days to get used to the complexities of a forecast and prepare the public, governors and mayors only had about two days to message the increasing seriousness of this event. They seemed to have succeeded in doing so, with airlines canceling thousands of flights in advance of the wintry onslaught, city and state travel bans going into effect prior to the arrival of the worst conditions and other steps taken to ensure the public’s safety during this event. It could have been a lot worse, given the scenario: a rapidly changing forecast, a historically intense storm taking a textbook-perfect track to slam the I-95 corridor and increasingly urgent public safety messaging.
I can assure you that as recently as a decade ago it would have been a lot worse, and when I started my career in the last 1980s, this event almost certainly would have been a catastrophic event with many, many fatalities and much more serious and prolonged societal impacts. The fact that it was not is because of the tremendous advances that meteorological research has enabled in the last four decades. While the last year has given me pause as to whether or not we will continue to make this sort of progress going forward, assuming we continue to smartly invest in and support the science, I truly believe we will see a revolution in meteorological services in the next four decades that surpass what we have seen in my career.

Leave a comment