And the record warmth continues in the East
Mar 08, 2026

As expected, Saturday brought additional severe thunderstorms along a cold front that moved slowly through the eastern and southern US. Most of the incidences were in the form of strong winds, with a number of reports of downed trees and powerlines associated with a line of severe storms that moved across eastern Ohio and western Pennsylvania. Other reports were associated with clusters of storms that formed farther southwest along the front.
Going back to Friday’s severe weather, NWS offices conducted damage surveys in the aftermath on Saturday, and determined that the intense tornado that impacted the area near Union City, MI and killed 3 people was at least an EF3 tornado with maximum winds of 150 mph. This makes this tornado the earliest EF3+ tornado on record in the state of Michigan. Meanwhile, the earlier tornado (from the same supercell storm) that produced heavy damage and a fatality in Three Rivers, MI was rated at least an EF2 tornado. This was the earliest killer tornado on record in the state (by two weeks). If you would like a deeper dive on the meteorology of and damage from this event, the “Debris Ballers” podcast I am on did an episode on this event yesterday that you can find here.
After a lingering risk of a few severe storms along the Mid-Atlantic coast this afternoon as the cold front continues to move offshore, the threat of severe weather this week will be governed primarily by the movement and interaction of two main upper level weather features: an upper level low off of Baja California and a disturbance over western Canada.
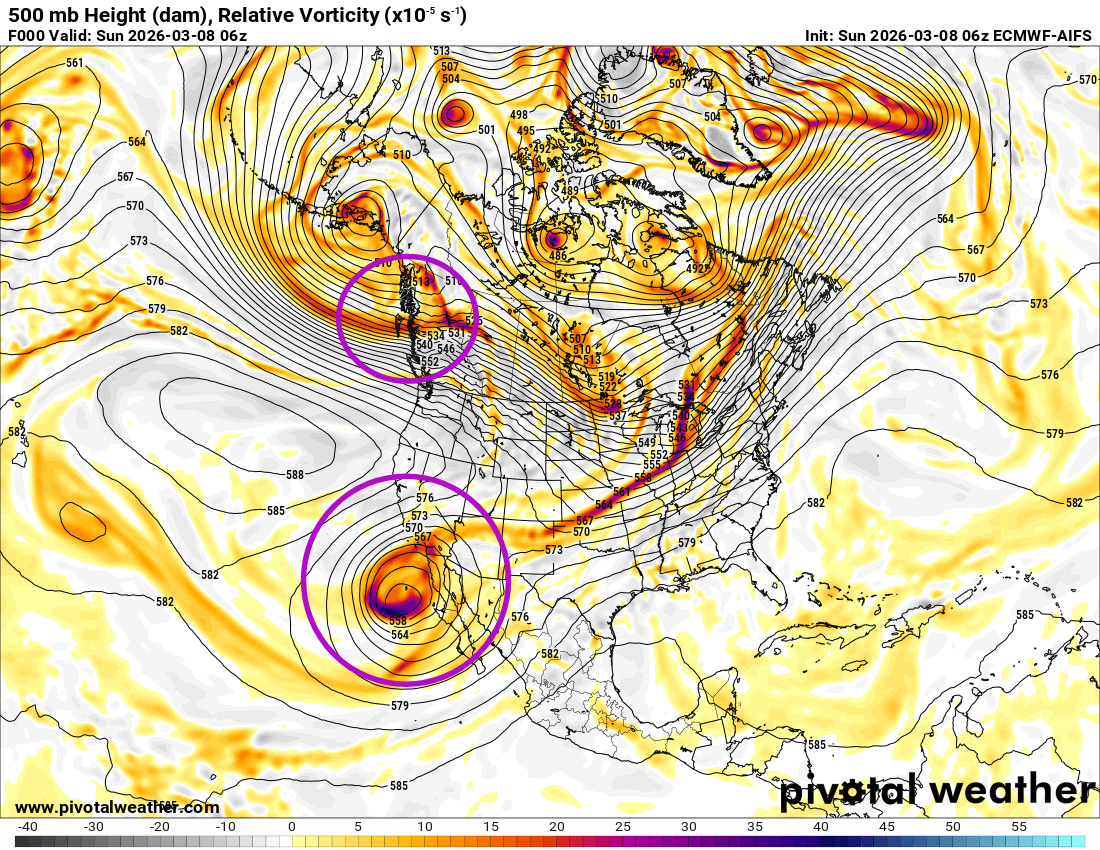
This European AI model animation of 500 millibar (~18,000 ft AGL) height contours (pressure on a surface weather map) and vorticity (atmospheric spin) for the next 5 days shows how the western Canada system dives southeast while the upper level low gradually opens up and moves east. How far southeast the northern system gets — and how much it interacts or “phases” with the southern system will play a key role in what areas are impacted by severe thunderstorms this week and how intense the activity will be. The forecast upper air evolution shown here is just one possibility, and given this complex atmospheric interaction there is quite a bit of uncertainty in the evolution that will need be sorted out in the coming days.

This NCAR European AI ensemble forecast seems to be a reasonable depiction of severe weather probabilities as the week goes on. After an initial risk of some hail producing supercells in the Mid-South on Monday afternoon and night well ahead of the Baja upper low, Tuesday’s severe weather risk looks to be bi-modal, with one area of focus in Texas with the upper low and the other in the Mid-Mississippi Valley ahead of the northern disturbance. Those risk areas then shift east for Wednesday.
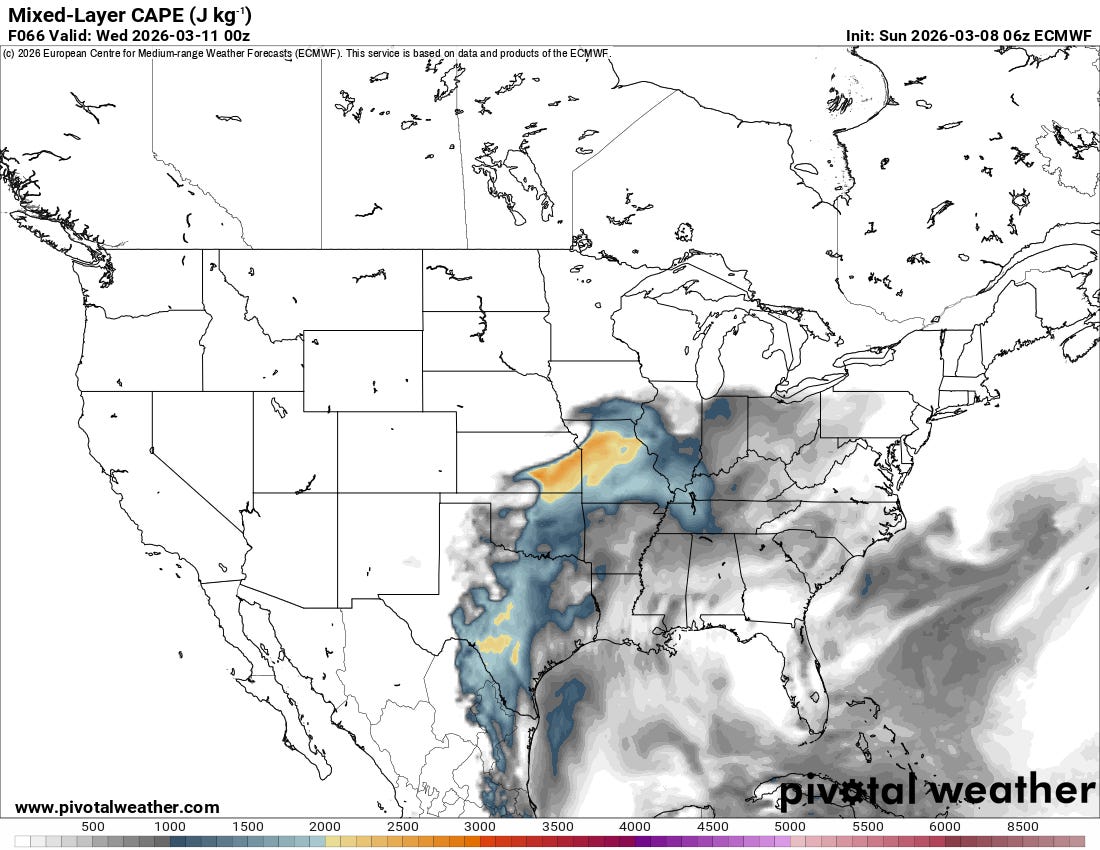
The meteorology of the severe weather risks this week seems a bit unusual to me for early March, as there appears to be rather ample low level moisture and instability available (European model forecast of convective available potential energy — CAPE — shown above), more typical of a later spring system. These setups are more unpredictable given than they are more driven by atmospheric evolution on the thunderstorm scale than more predictable large scale systems — so when you combine that with a more uncertain than normal large scale, it seems clear that predictability is much less than normal for the upcoming week. Having said that, the available moisture and instability combined with relatively strong upper level systems and associated wind shear means that some higher end incidences of severe thunderstorm hazards (tornadoes, large hail and straight line winds) look possible, so those in the threatened areas should be paying attention to forecasts as the week goes on.
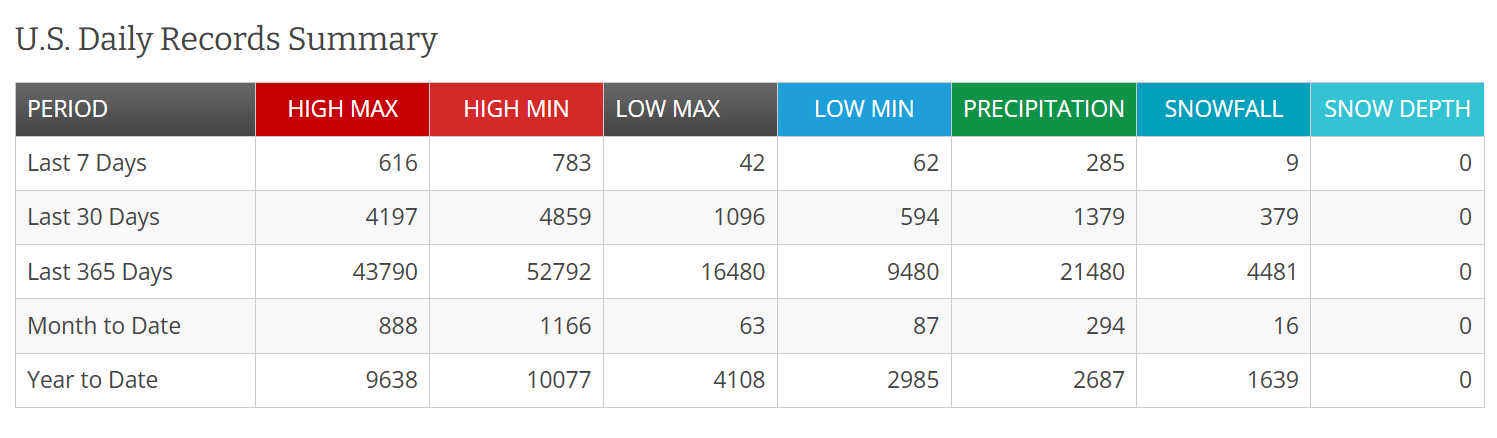
The severe weather of the last few days has been my main focus, but I wanted to quickly highlight the extreme warmth that much of the eastern half of the country has been experiencing the last several days. Hundreds of record warm temperatures were set in the last week across the region.
With the warmth it has been feeling very springlike for many — and some very cool tools that a Balanced Weather subscriber made me aware of for monitoring the onset of spring are these graphics from the National Phenology Network that monitor the first leaves and blooms of the spring. You can see in this leaf index animated gif how the West has been consistently seeing first leafs earlier than normal, while the East had a slowing due to the colder than normal weather but has been accelerating ahead of schedule over the last few weeks. In the Central Plains, the spring leaf index is now weeks ahead of normal.
The spring bloom index obviously lags the leaf index, but you can see it surging north in recent days. I can report from central Oklahoma that numerous trees have started blooming in the last few days. These will be very interesting maps to monitor in the coming weeks — especially given that a couple of more (likely brief) shots of cold air are expected for at least the Midwest and Northeast behind the weather systems of this week.
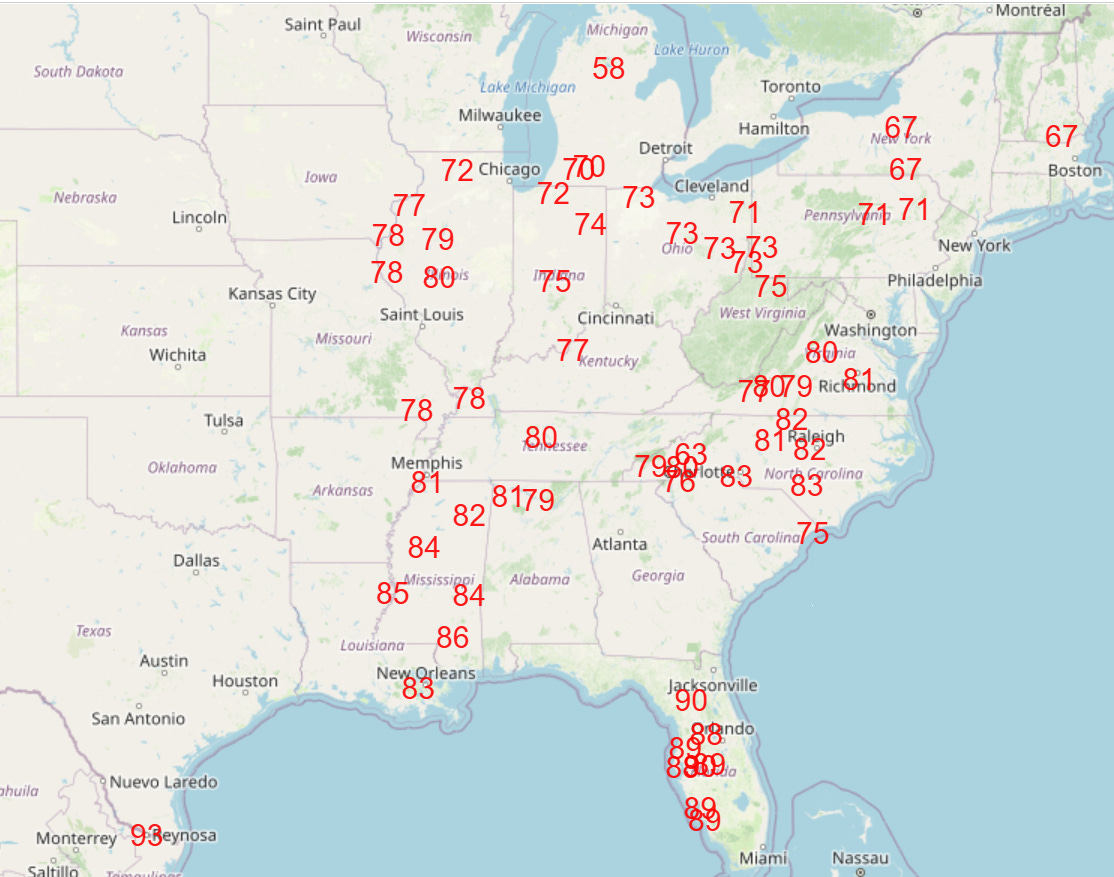
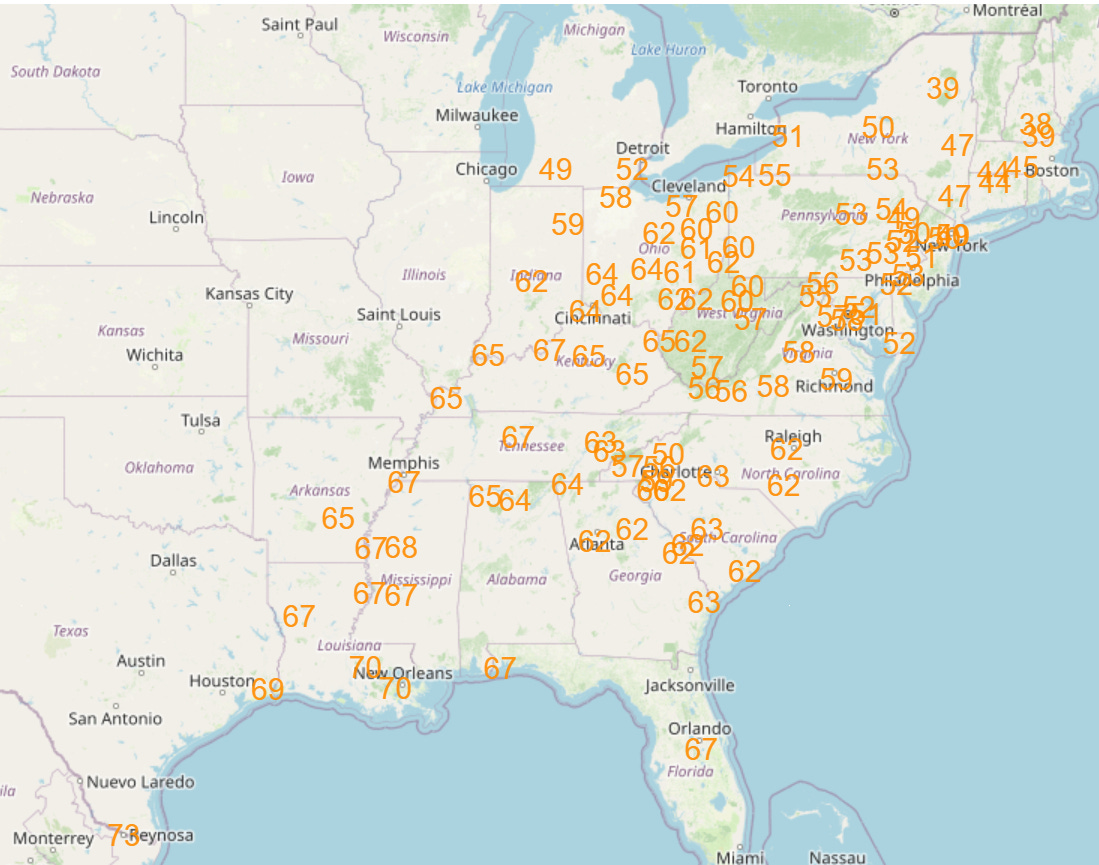
In the meantime though, hundreds more warm records are expected this week ahead of the weather systems coming east (NWS forecast record maximums and record high minimums for Wednesday shown above).

Leave a comment