How weather tools can help identify and track meteors. Also, recapping Monday severe and winter weather and looking at the building historic heatwave in the West.
Mar 17, 2026
Starting off this morning with some breaking semi-weather related news. Shortly before 9 am EDT this morning many residents of the lower Great Lakes and upper Ohio Valley regions were startled by a loud explosive sound, which appears to have been the result of a meteor entering the Earth’s atmosphere. This story from EarthSky gives an update on what has been reported along with some videos of the daytime fireball that many people observed.
Interestingly, remote sensing tools that meteorologists use to monitor weather features can also be used to help confirm and tracks objects such as this entering the atmosphere. On this visible satellite loop from this morning, I have overlaid data from the satellite-based GOES Lightning Mapper (GLM) which clearly detected the energy discharge over western Lake Erie from the descending meteor.
The NEXRAD (WSR-88D) Doppler weather radar network is also a key tool used by scientists to track meteors entering the Earth’s atmosphere and other space debris. Weather radar is used by NASA for meteor tracking in addition to its All Sky Fireball Network of cameras and the American Meteor Society’s reporting network. My recently retired National Severe Storms Lab colleague Ken Howard has been very active in research using NEXRAD radars for tracking incoming space objects. He noted to me this morning that NEXRAD has long been used for observing meteorites and reentering spacecraft (including the tragic Columbia disaster), and this capability has improved with the implementation of dual-polarization technology in 2013. As he said, NEXRAD “is an incredible remote sensing tool beyond just weather.” Analysis of the radar data from this morning’s event is still ongoing.

Turning to the recent high impact weather, as I discussed in yesterday’s post, the severe weather setup for the East on Monday was a challenging forecast given the environment supporting the potential for higher end wind damage and tornadoes, but numerous complicating factors including multiple waves of storms. For the Mid-Atlantic region, the narrow but intense line of storms right along the cold front Monday night did appear to end up being the most impactful aspect of the severe weather, with hundreds reports of wind damage. This included numerous measured wind gusts greater than 60 mph, including rather impressive gusts of 68 mph at Reagan National Airport, 66 mph at Dulles Int’l Airport, 71 mph at Newark Airport and 72 mph at JFK Airport. Hundreds of thousands of customers lost power, and as of midday today about 300K customer remain without power in the Mid-Atlantic and Northeast.
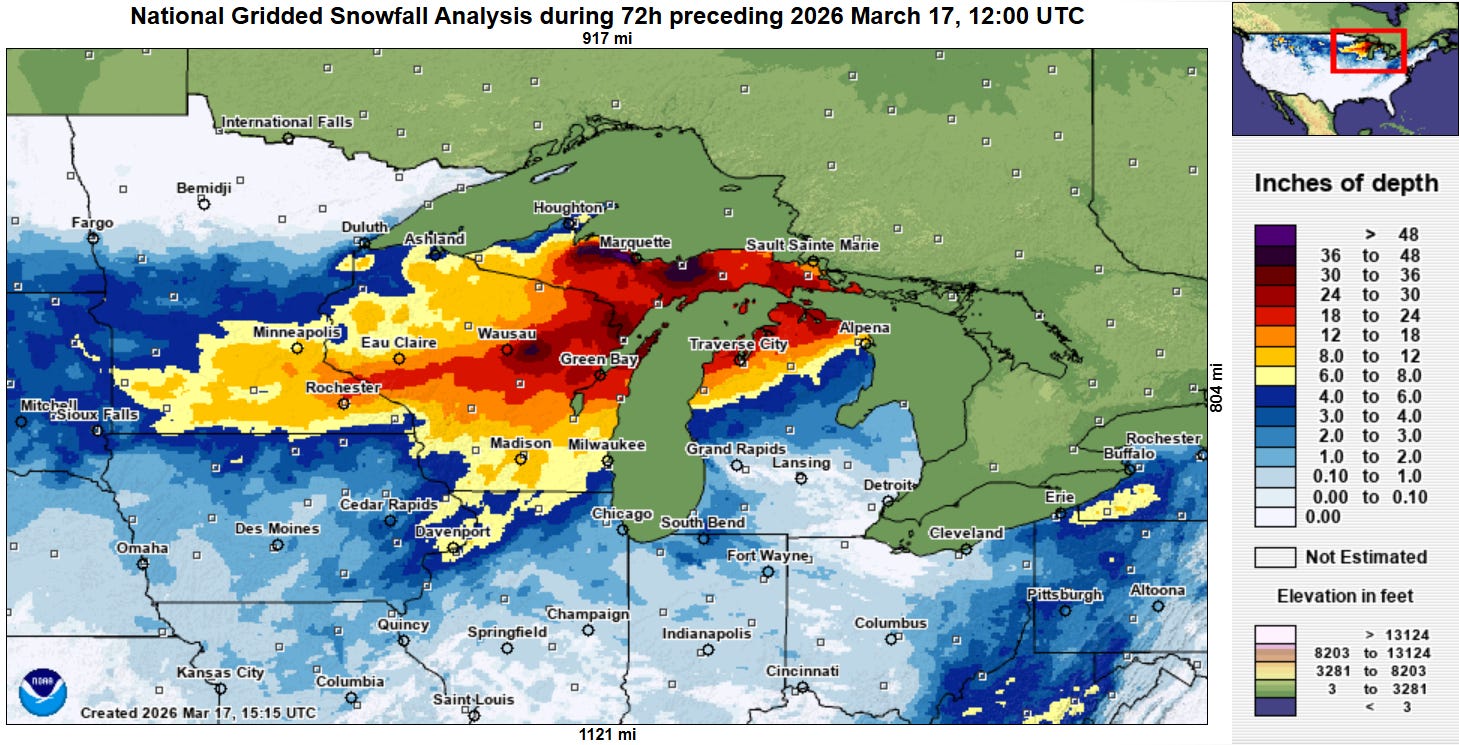
The full extent of the snowfall associated with the blizzard is now a bit longer than a 72-hour snowfall analysis, but you can still clearly see the areas that saw the heaviest snowfall with spots along Lake Superior now in excess of 3’. As of 10 pm CT last night, the highest observation reported to the NWS was 36” near Herman, MI. Wausau, WI shattered its all-time snowfall record for a single day on Sunday with 23.4”, breaking the previous record of 15.7” set in February 2019. The 23.4” total on Sunday would have nearly doubled the record prior to 2019 of 13” — which is incredible given that context that records at Wausau go back to 1895.
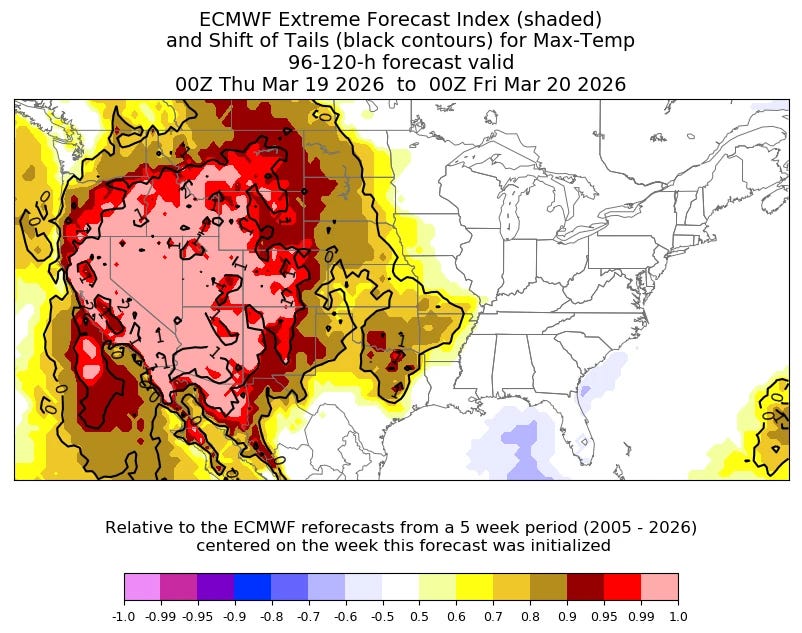
Speaking of extreme weather records, we are now approaching the heart of a historic Western US March heat wave which will rewrite records for many locations. This graphic above courtesy of Jacob DeFiltch on BlueSky shows how the European Centre’s Extreme Forecast Index (EFI) is absolutely maxed out for temperatures at many locations in the West on Thursday — and this will be the case into the weekend as well. From the perspective of how anomalous this event is, this heat wave looks very similar to the 2021 Pacific Northwest heat wave.
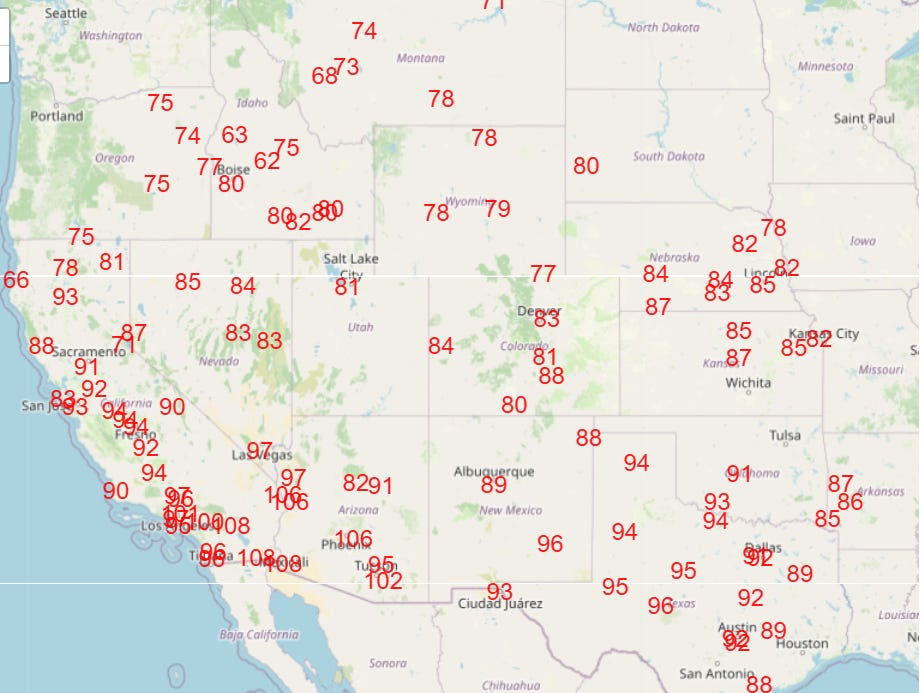
Friday (forecast record maxes above) into Saturday looks to be the absolute peak of the event, when hundreds of daily warm temperature records will be shattered, and many monthly records for March (and even April) will be set.
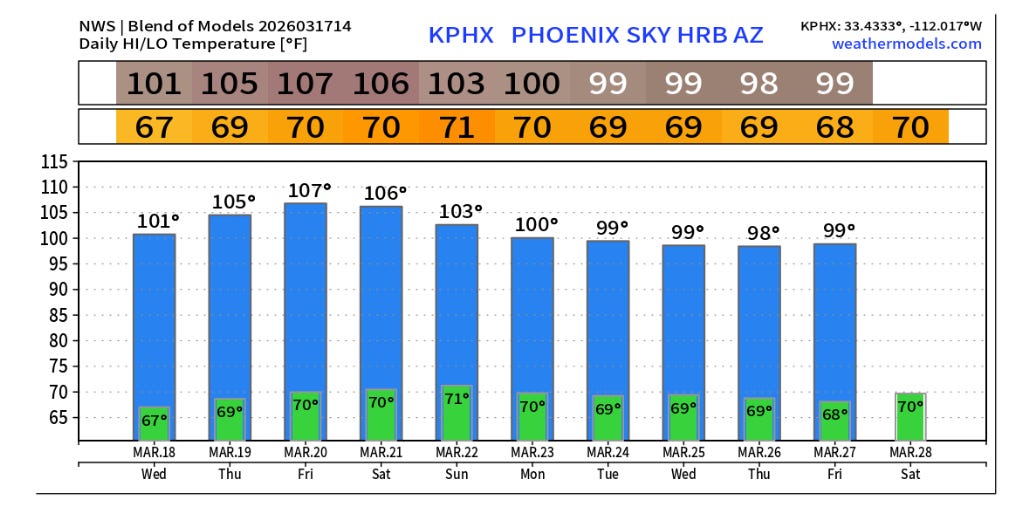
Looking at a couple of specific sites for perspective, these are the forecast daily high/low temperatures for Phoenix from the most recent NWS National Blend of Models (NBM). Going into this event, the all-time record high temperature at Phoenix is 100F, set March 26, 1988. Obviously, what is shown above is a forecast, so we will have to see what actually occurs — but if this forecast happens as shown, Phoenix would set a new monthly record high temperature six days in a row (and in the 3rd week of the month when most March warm records are set toward the end of the month). If the max temperature at Phoenix reaches at least 105F on one of these days, it would tie the monthly record for April and would be the earliest 105F by about a month (April 20th current record). If the max temperature actually reaches 107F, it would be the earliest incidence of this reading by about 6 weeks (current record May 2nd).
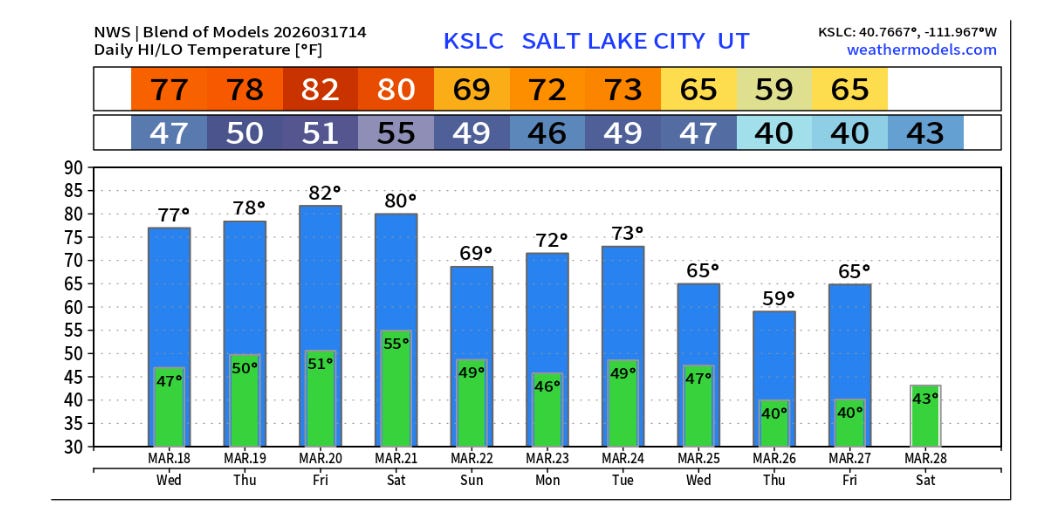
For a location farther north, Salt Lake City is forecast to break its record March temperature by 2 degrees and see its earliest 80 degree temperature by 10 days. A high of 82F would be the earliest that reading was reached by more than 2 weeks.
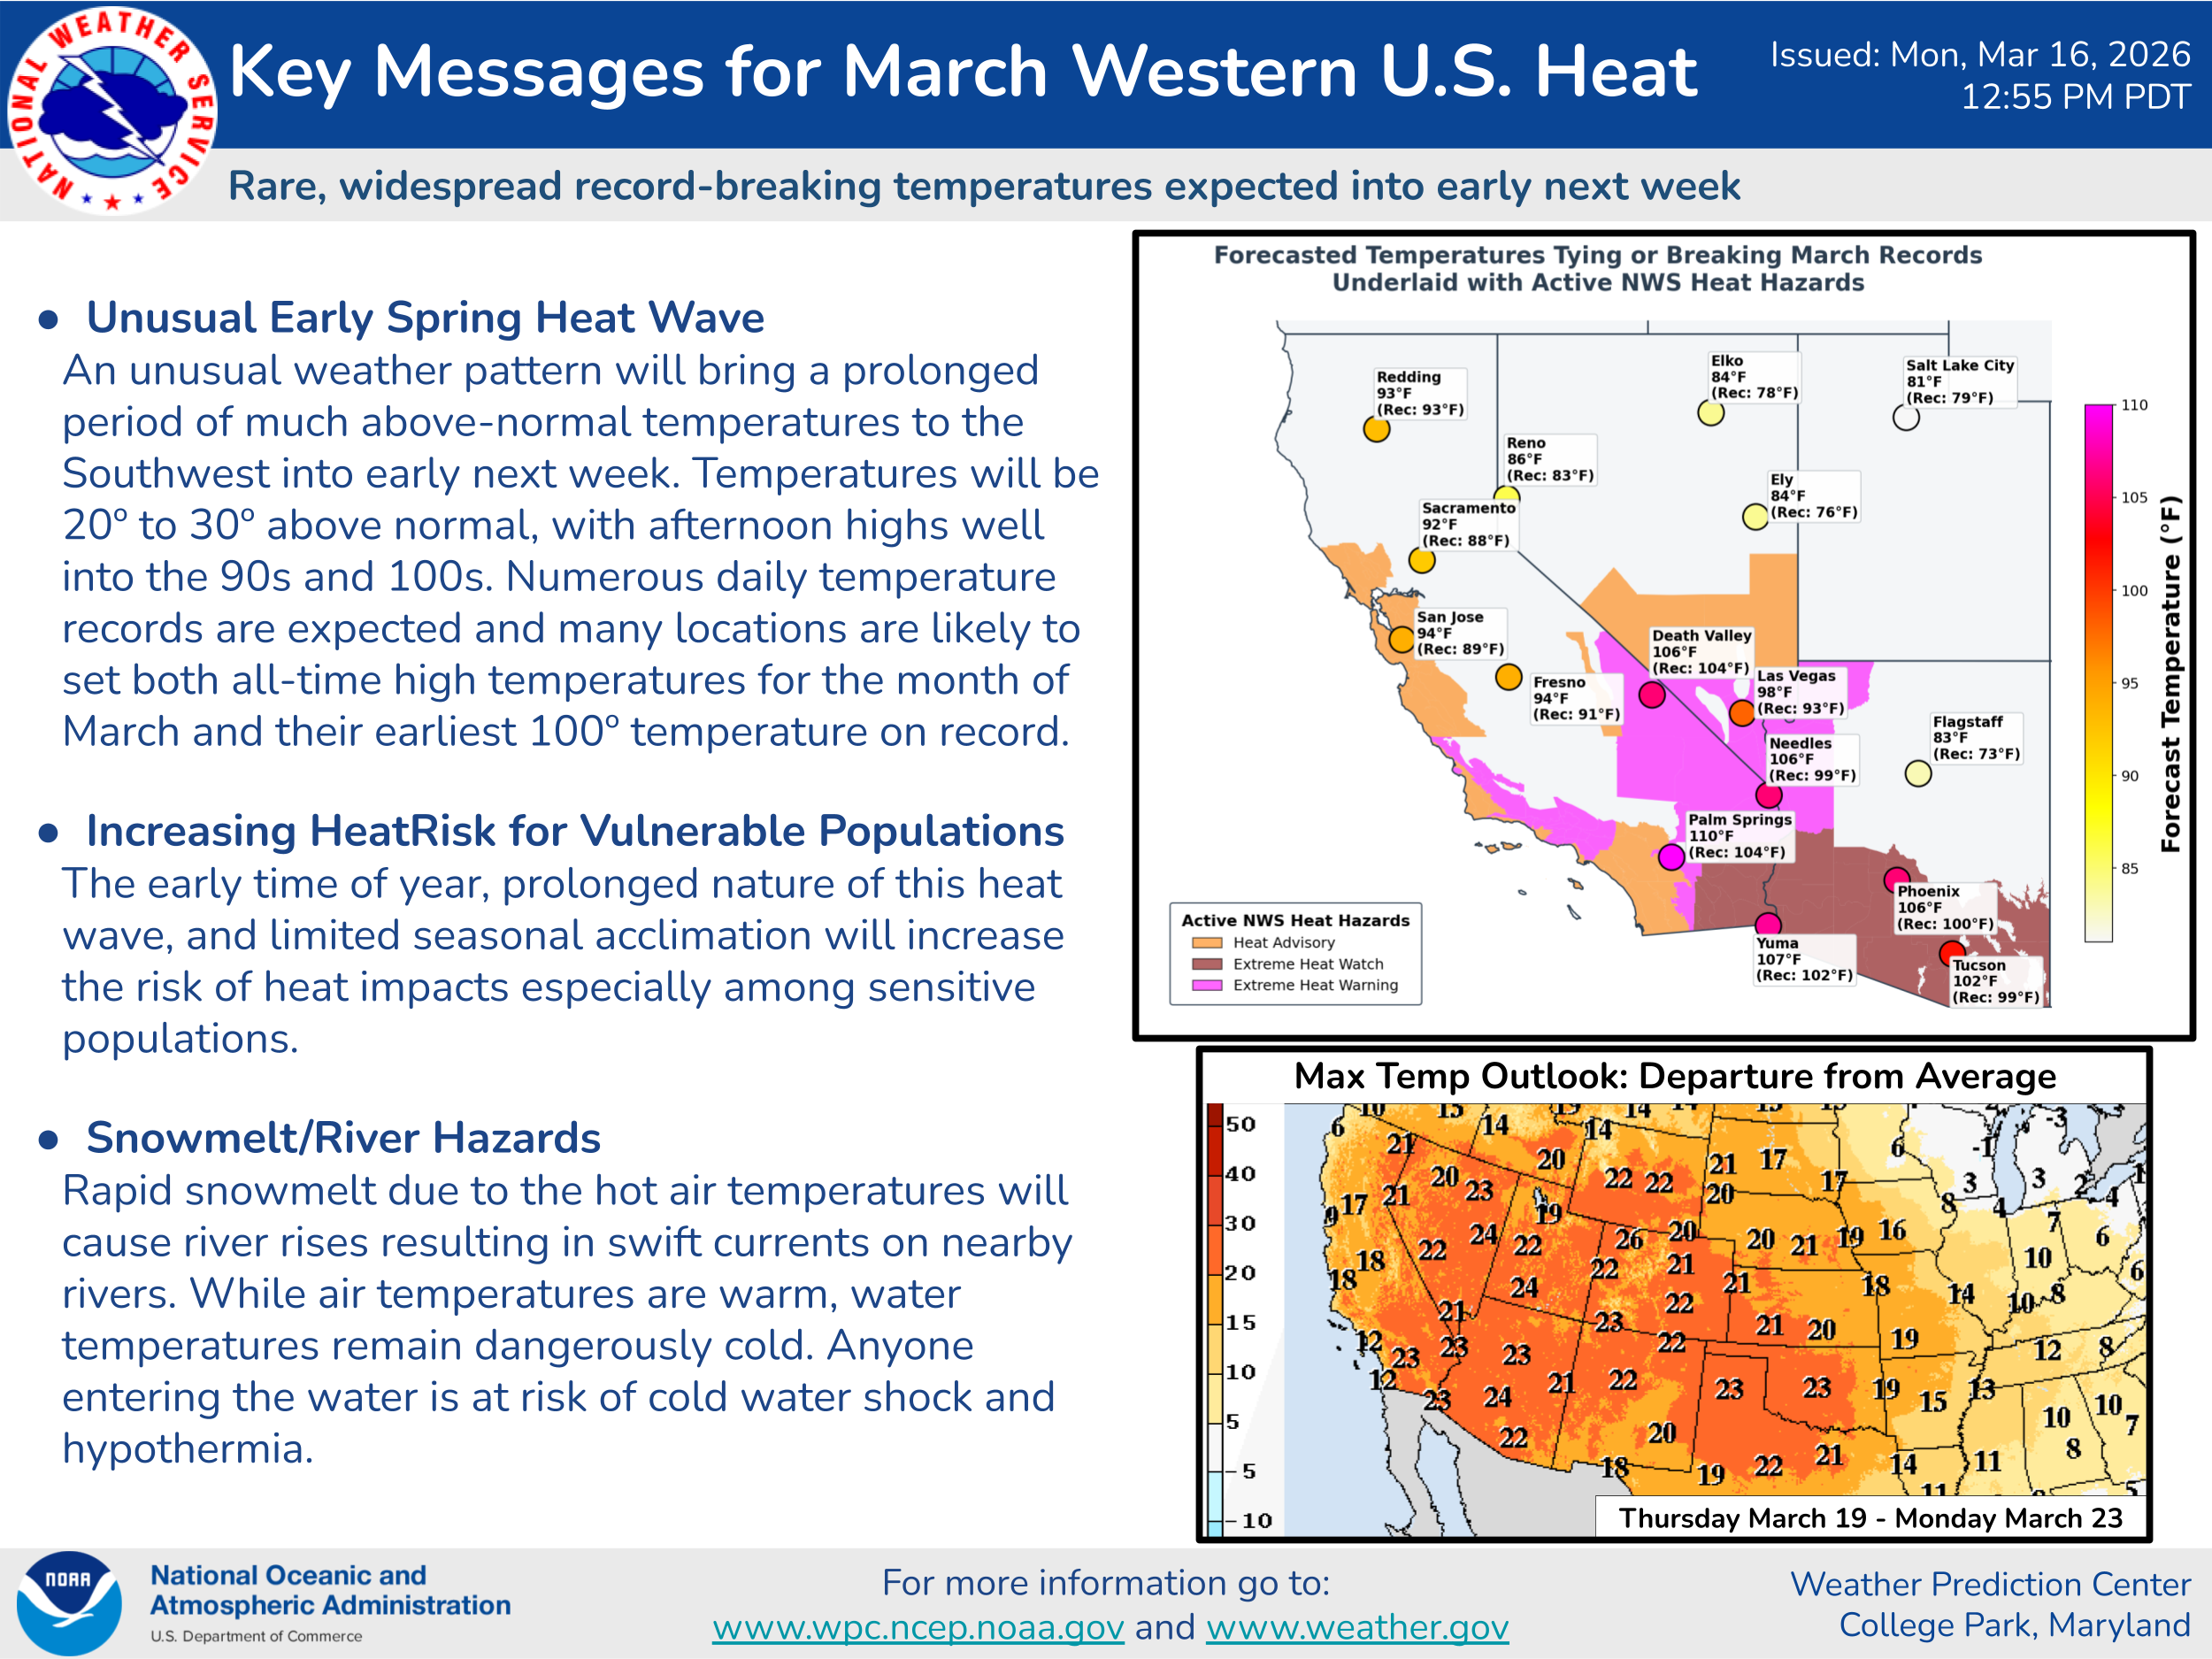
Not only is this heat unusual, it will be extreme enough to cause heat risk issues, particularly given how early in the season it is. If one of the southern California desert locations can hit 110F in the next few days, it would be the earliest on record ever for the US. Obviously, more to come on this historic event in the next week.

Leave a comment