Eastern US looks to see multiple days of record warmth
Apr 11, 2026
Good Saturday afternoon – wanted to get out a quick post with updates on a couple of weather situations.
Typhoon Sinlaku is continuing to slowly intensify to the southeast of the Mariana Islands, with the latest infrared satellite imagery showing an eye starting to form in the northern part of the central dense overcast. The latest afternoon advisory from the US Joint Typhoon Warning Center has the current maximum sustained winds in Sinlaku estimated at 110 mph, just below the equivalent of major hurricane status on the Saffir-Simpson Hurricane Wind Scale.
As far as track, the trend toward the left closer to Guam that the Google DeepMind model showed yesterday appears to have been a brief hiccup, as the model trends over the last 24 hours have all been toward the right with a track farther north across the Northern Mariana Islands. This is most likely due to a more northward motion in the last day as the typhoon has been organizing.
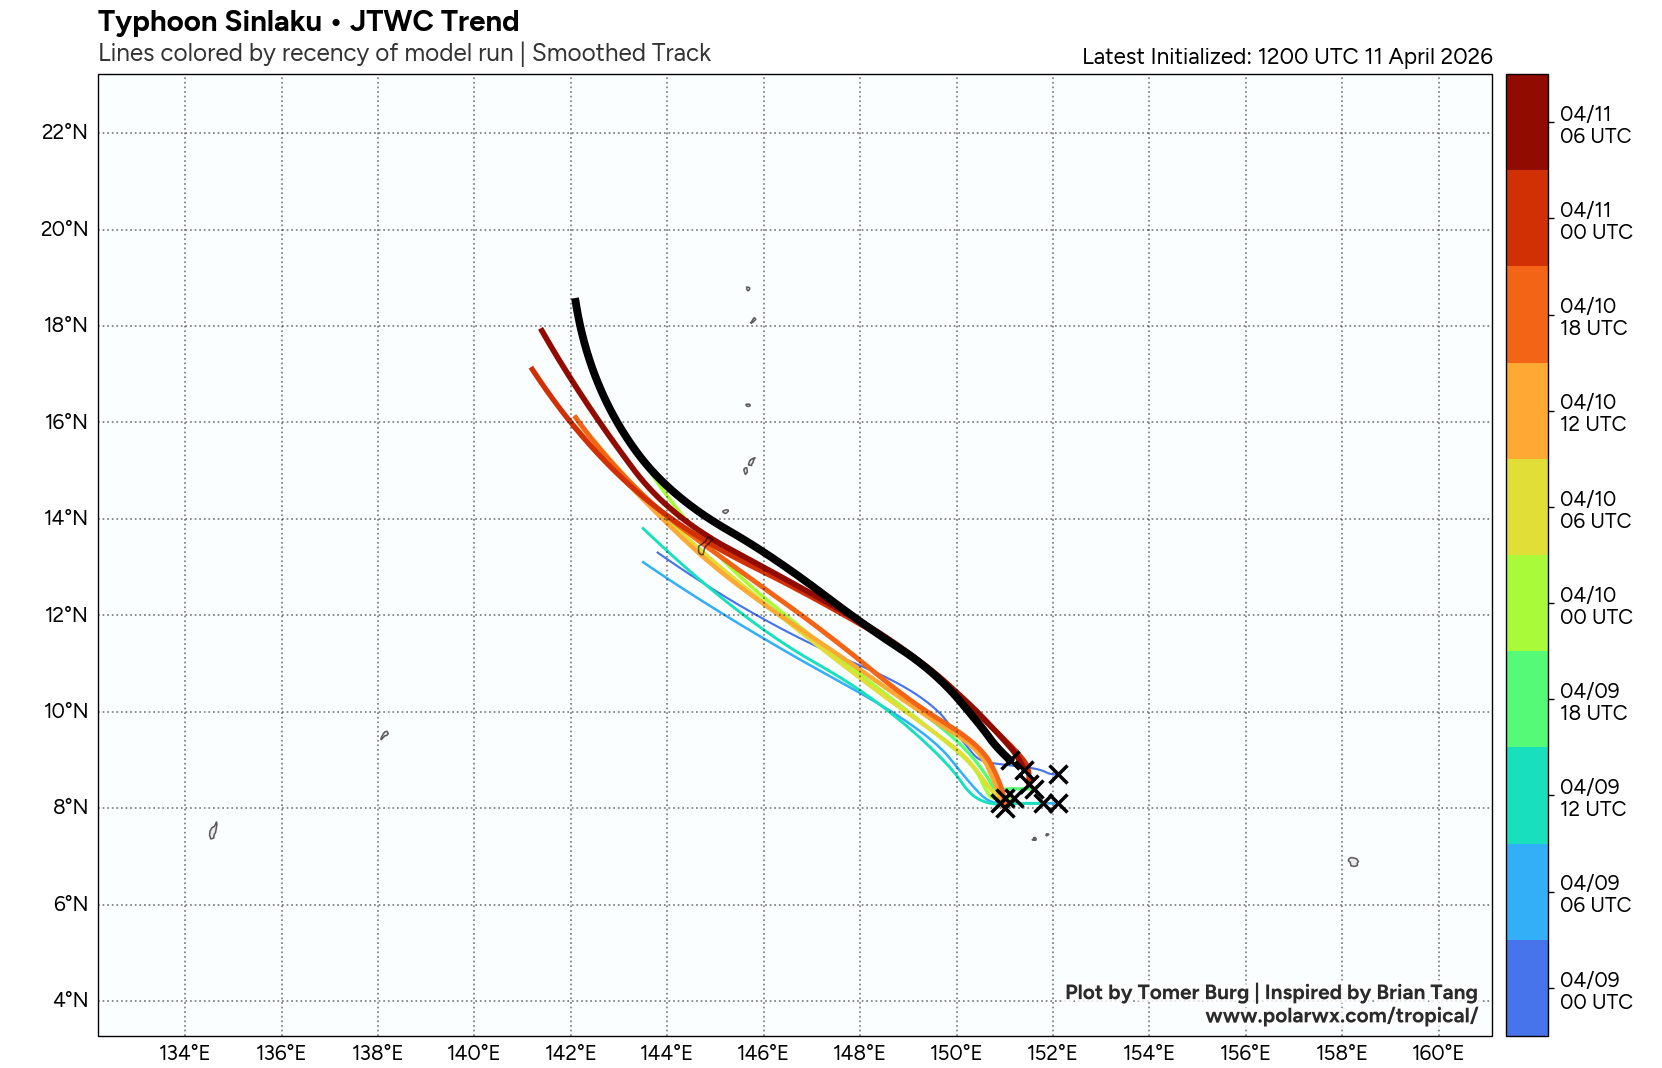
The official forecast from JTWC has followed suit as shown in the track trend graphic from PolarWx.com — the black line is the most recent forecast, and now has the typhoon passing close to Saipan. This trend is favorable for Guam as it would mean that the island would be on the left, weaker side of the storm. Saipan — which has a population of just under 50K — would be more under the risk of a direct impact from the core of the typhoon, which is forecast by JTWC to have maximum sustained winds of 150 mph as it passes through the islands sometime late Monday (CONUS time).
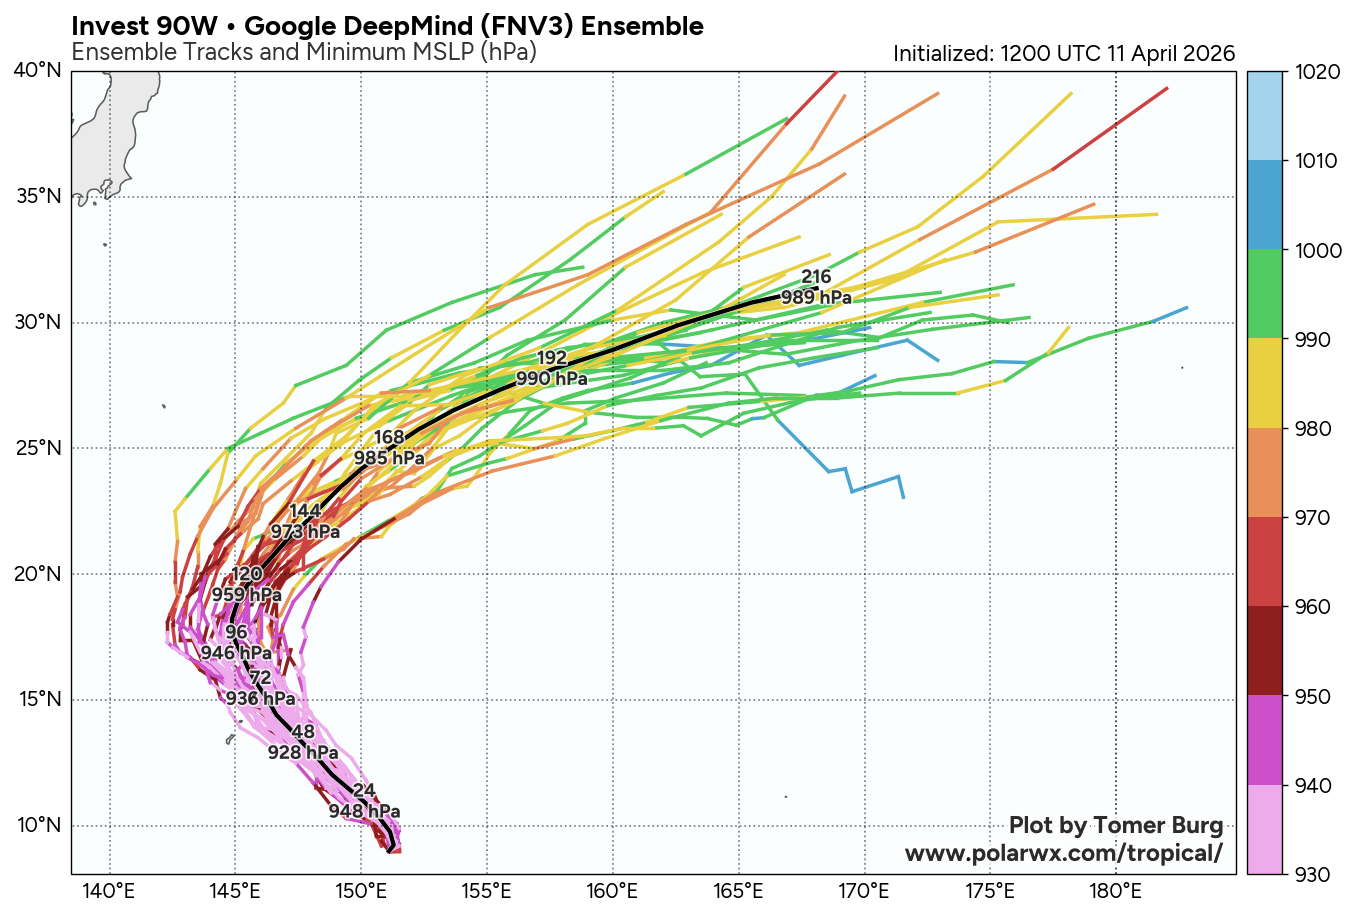
Obviously, forecast uncertainty remains. As an example, the Google DeepMind ensemble has a spread of tracks from just to the northeast of Guam to passing northeast of Saipan. Trends over the next 24-36 hours will be crucial as far as impacts in the Marianas.
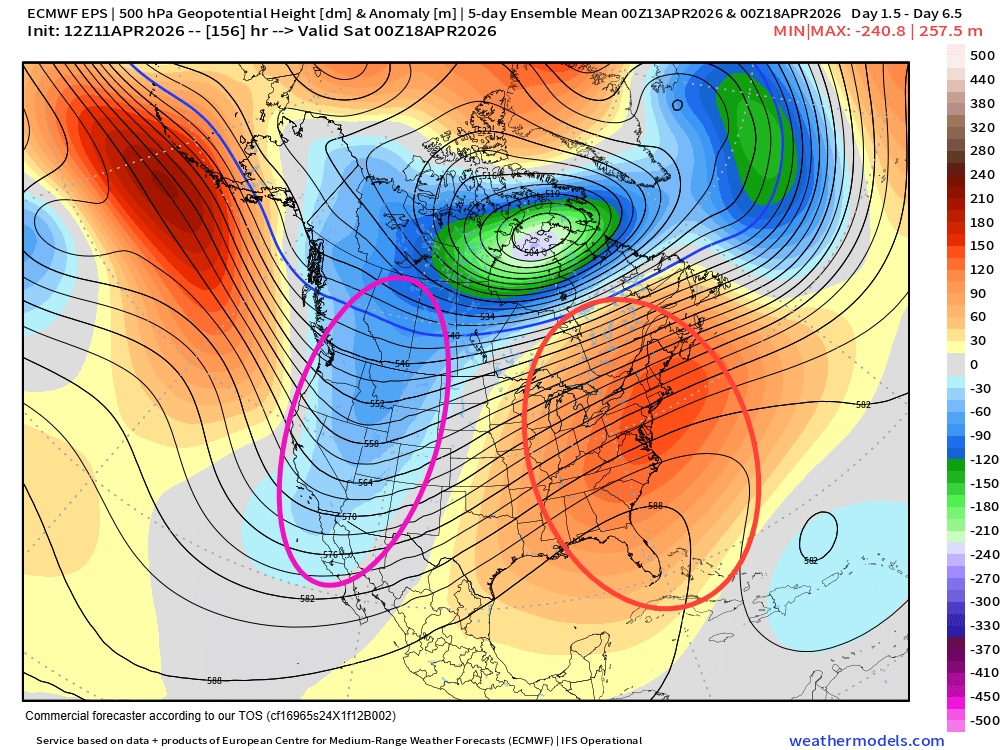
The US weather pattern next week still looks as if it will be dominated by an upper level trough of low pressure in the West (purple ellipse), with a large and unusually strong upper level area of high pressure over the East (red ellipse).

This will yield a relatively active weather pattern with multiple days of severe weather risk as shown in the NCAR AI severe weather probabilities based on the European model. As of right now, though, there does not appear to be a particular intense system or setup that looks favorable for a higher end outbreak of severe storms, but there will certainly be some more localized threats of significant severe weather within these daily risk areas.
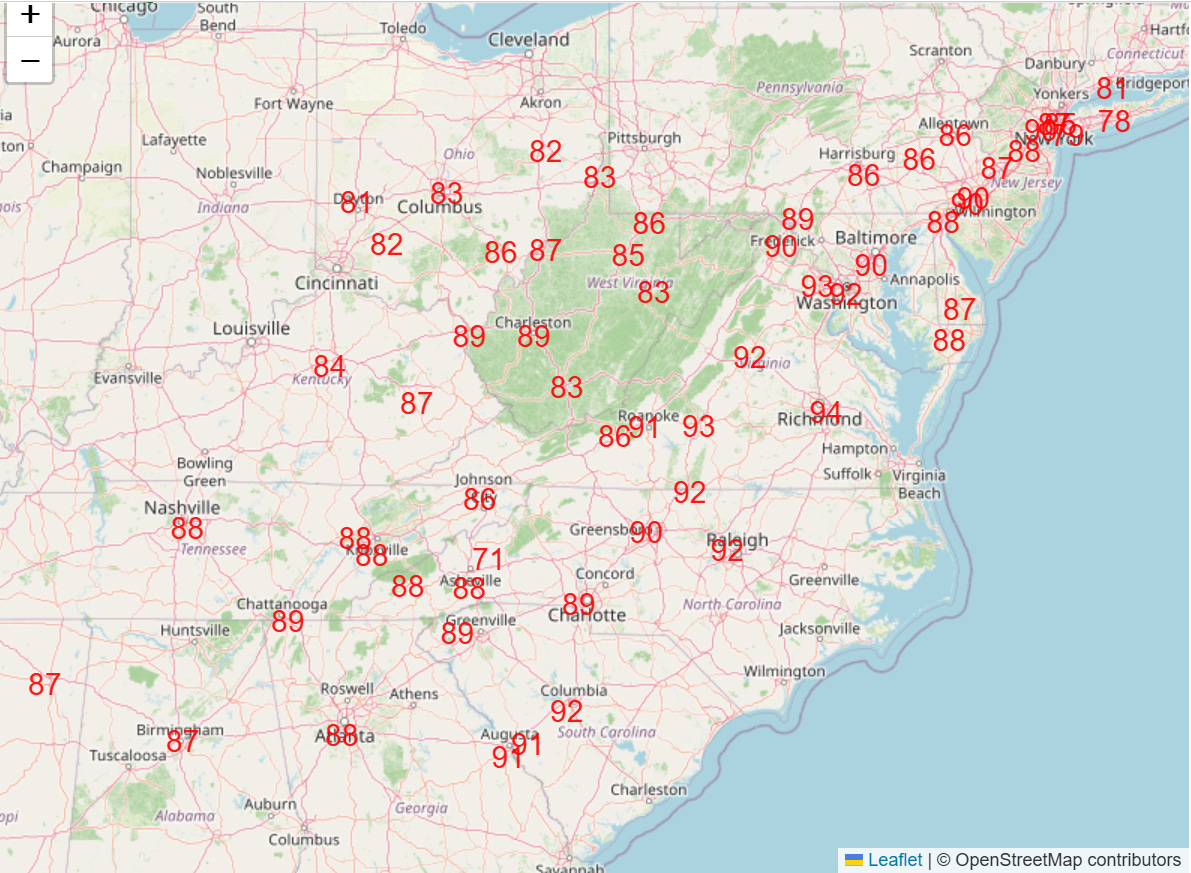
Perhaps the biggest weather story next week will once again be unusual record warmth under the upper level high pressure area. Dozens of record warm temperatures (Wednesday NWS forecast high temperatures at or above records shown above) are expected across the eastern half of the country, with highs reaching the 80s and 90s across the Ohio Valley, Southeast and Mid-Atlantic.

Leave a comment