As March approaches its end and April rolls in, we are getting closer to the peak of severe weather season from a national perspective.


If we look at how severe weather probabilities change from the beginning of April (top image) to the end of April (bottom image), we can see the probabilities ramp up significantly over the month and encompass a larger expanse of the country. Some of the nation’s most infamous severe weather outbreaks – including the “Superoutbreaks” of 1974 and 2011 – occurred in April.
However, climatology is not a forecast, and of course we have quieter and more active periods of severe weather each spring, and it is potentially useful to many users of weather forecasts (e.g., emergency managers) to be able to anticipate more active periods. There are signs that the weather pattern over the next 7 to 10 days will be one that favors more active than normal severe weather on a large scale. Given that, I thought this would be a good time to take a bit of a deep dive into some of the tools forecasters use to try to anticipate these active weather patterns, and some of the ongoing research to try to improve our ability to provide outlooks for longer time ranges.
Meteorologists typically define the medium range as 4 to 8 days from today; side note, when I started as a meteorologist 35+ years ago it was days 3 to 5, so that gives you some perspective on how we have pushed out our forecast skill over the years. Beyond day 8 is long range, and eventually you get into subseasonal and seasonal outlooks, but for today I am mainly going to concentrate on out to about 8 to 14 days.
In a general sense, as you get farther out into the medium and long range, you are less trying to forecast individual weather systems and more trying to anticipate the general atmospheric wave pattern. Ensemble model forecasts are now used extensively by meteorologists at all time scales, but initially they were primarily focused on medium and long range forecasts because they could give meteorologists a pretty good idea of that general flow pattern. For example, let’s look at how the 500 mb pattern is forecast to evolve over the next 10 days by this morning’s European ensemble model.
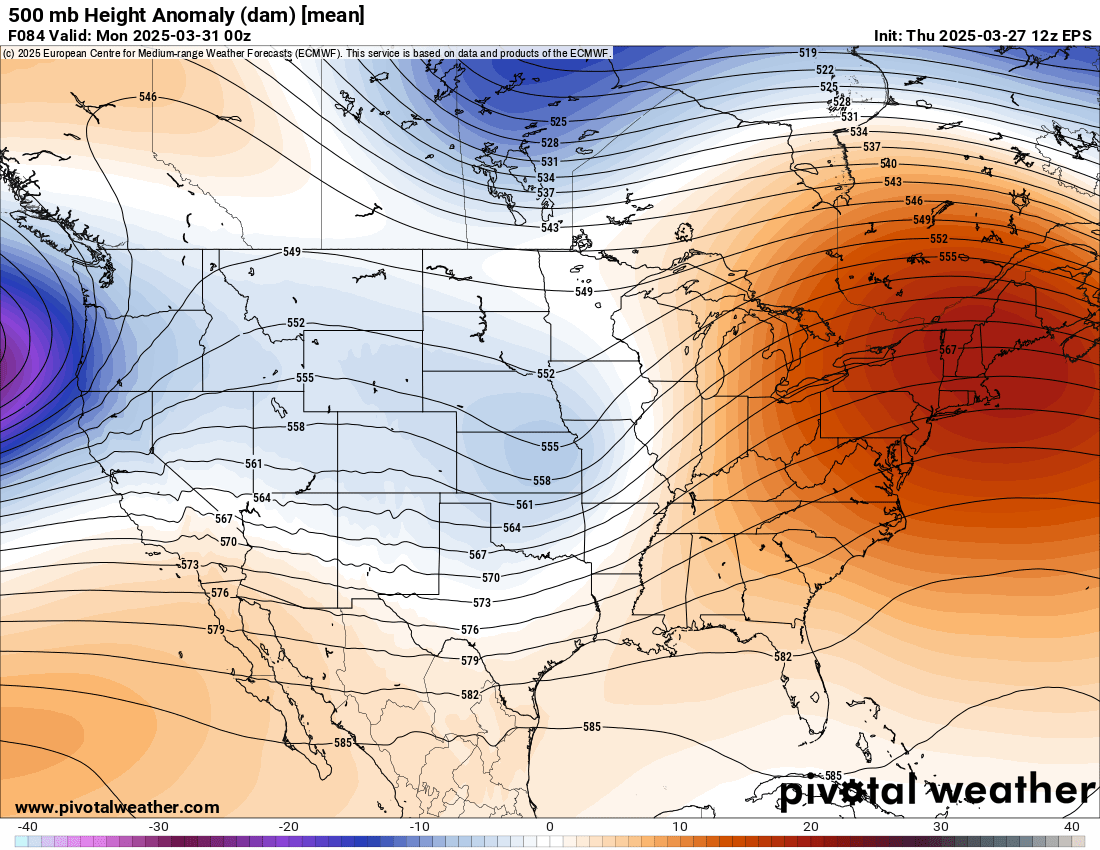
This is the 500 mb height forecast (heights on an upper level chart are similar to pressure on a surface weather map) valid for Sunday evening (day 4), and the image is the height anomaly, i.e., the difference in the forecast height value from the normal height value for this date. On this chart, you can see the main weather system that affected the Pacific Northwest yesterday is now forecast to be over the central US and should be the focus for potential severe weather as discussed in this morning’s newsletter.

As we go out a couple of more days to Tuesday’s forecast (day 6), you can see that the height pattern is becoming more smooth with fewer discernible waves. The farther out we go in time, the differences in each of the 50 ensemble members that make up the ensemble forecast begin to smooth features out. However, when you average them all together, you can see that the most likely large scale pattern for the US is a large, anomalous trough in the western US with a downstream ridge over the Southeast US. At a large scale, this type of pattern is favorable for severe weather in the central US because you would typically have upper level systems ejecting through the region to produce storms, and the corresponding low level pattern would usually favor a southerly flow of moisture from the Gulf.
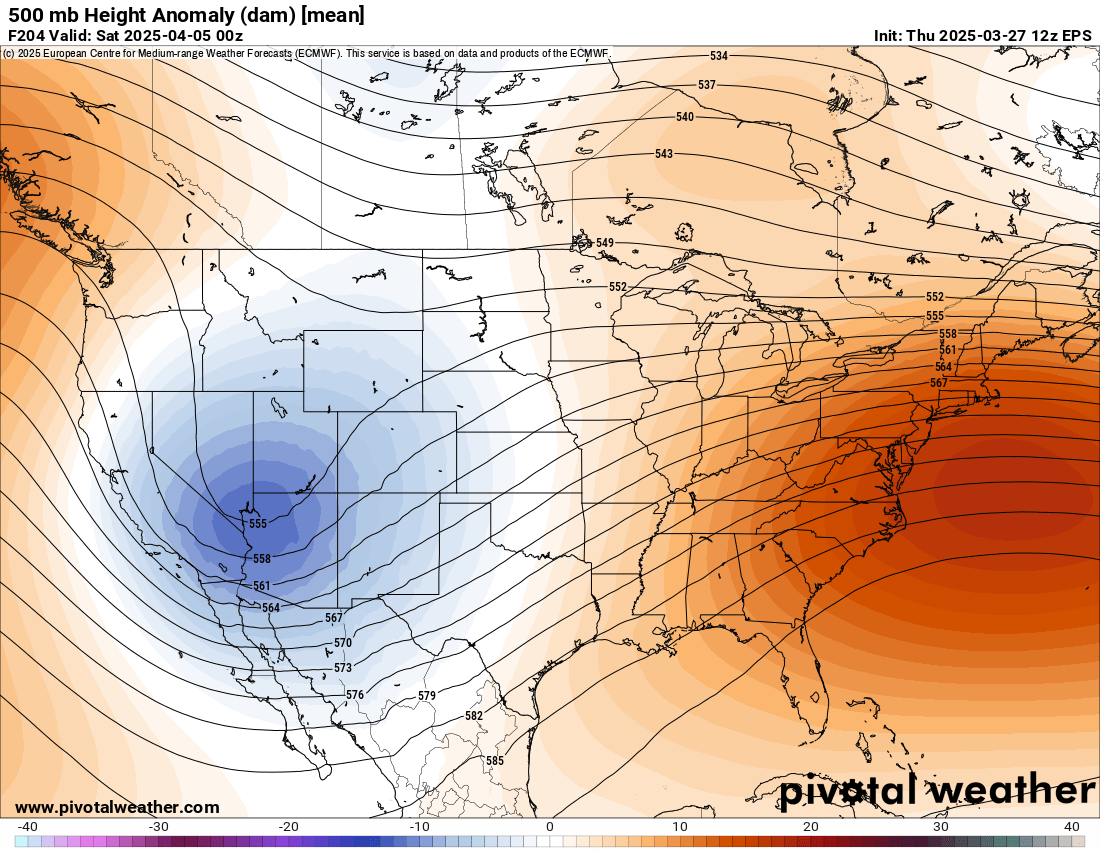
If we go out a few more days to Friday (day 9), we still see a similar overall pattern, but now with a trough centered more over the Southwest US, and a large ridge along the East Coast. Again, though, overall a favorable pattern for severe weather in the central US.
When I started my career, the NWS only did severe thunderstorm outlooks for the first two days of the forecast. Day 3 was added to the repertoire first, and then around the mid-2000s SPC began experimenting with a day 4-8 outlook; from what I can find online, I believe the official day 4-8 forecast started in 2007. Obviously, what I am discussing above as far as favorable patterns does not get to which specific days and what locations will have a greater risk of severe weather, which is what is needed to issue an SPC style probabilistic outlook. Hence, SPC’s day 4-8 outlooks are somewhat unique in that they can forecast “probability too low” – meaning the risk is not expected to be sufficient to warrant an outlook – or “predictability too low” – meaning there is not enough signal of a specific system or severe area in the model guidance to support an area. If the forecaster feels there is enough of a signal and risk, they can define a probabilistic area, 15% as a base value and 30% to forecast a higher level of risk.
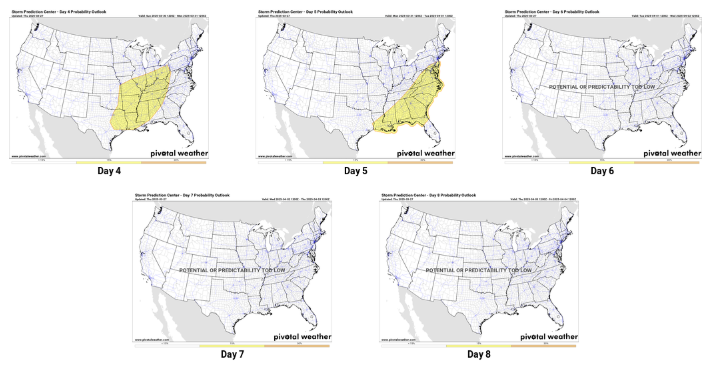
This is the current sequence of outlooks from SPC for days 4 to 8. You can see the 15% areas outlooked for days 4 and 5 for the system we discussed earlier. Right now, SPC has days 6 to 8 outlooked as “predictability too low.”
As the meteorological community has looked to push meaningful outlooks for all types of weather out farther in time, research for improving longer range severe weather outlooks has followed. An initial effort that is still being used by meteorologists today was the CIPS Analogs webpage developed by Saint Louis University. Essentially, this system takes the members of the NWS Global Ensemble Forecast System (GEFS) and looks through the historical records to find matches, or analogs, to the various forecast weather features It then rates the analogs based on quality of match and synthesizes the results to provide guidance to forecasters in their forecast process.
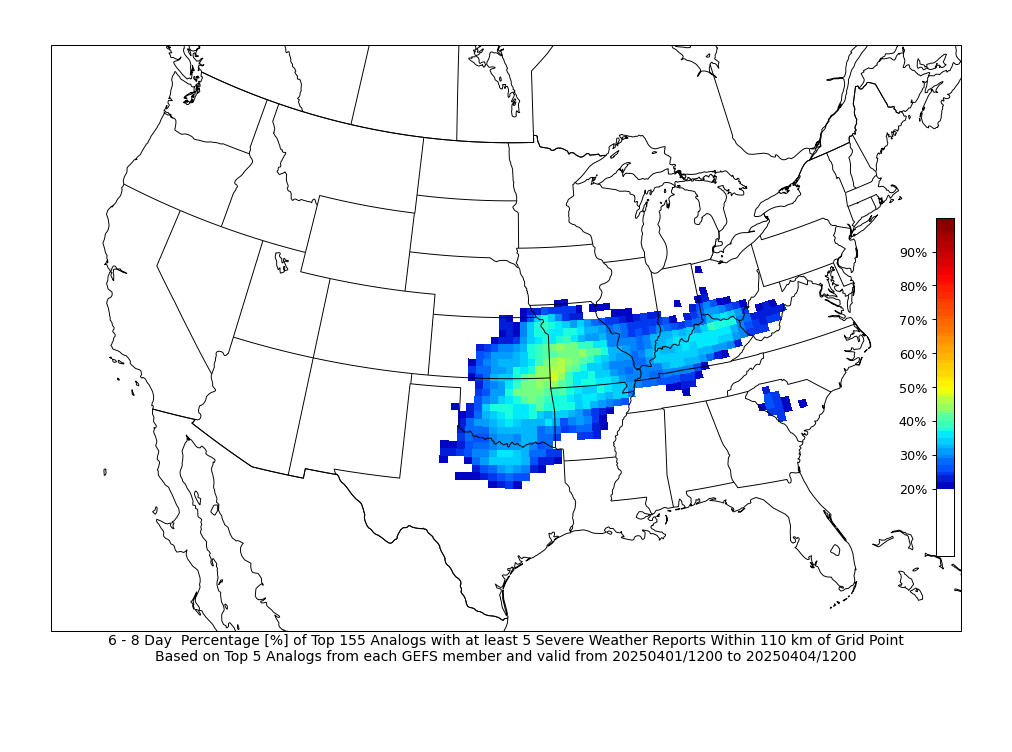
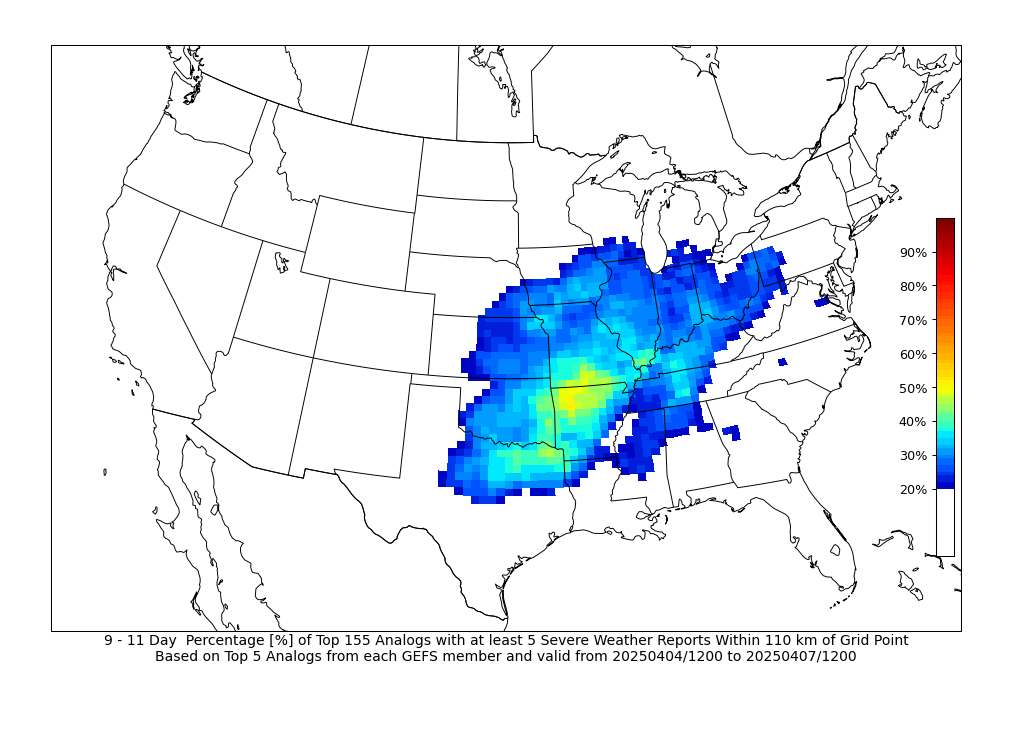
Here are examples of the type of guidance that CIPS produces. In this case, we are seeing the percentage of the top 155 analogs with at least 5 reports of severe weather within 110 km of any given point for days 6 to 8 and days 9 to 11. This type of guidance enables the meteorologist to be able to get more of a spatial representation of what areas have a greater risk for severe storms.
As you might expect, artificial intelligence provides the opportunity to do techniques like CIPS but much more robustly. One of the pioneering groups working on this for severe weather has been at Colorado State University. This research group has for several years now been producing AI probabilistic outlooks of severe weather (and flash flooding) using the same frame of reference (probability of severe weather within 25 miles of any given point) as SPC.

This is the current suite of severe weather outlooks from the CSU machine learning system (CSU-MLP) for the next 8 days. You can see that it has a 30% risk of severe on day 4 focused from the Arklatex to the lower Ohio Valley, which is a bit higher than SPC. (It also has a small area of 10% significant severe near Memphis). It has risks outlined on days 7 and 8 as well.
I have been a user of the CSU guidance and I find it to be an excellent tool for helping to anticipate severe weather risk; and you don’t have to rely on my subjective opinion, a 2023 research paper by Aaron Hill and Russ Schumacher of CSU and Israel Jirak of SPC objectively found that the CSU guidance outperformed human forecasts. However, there are still weaknesses to this approach; a big one is that, like CIPS, it is based on a single model suite, the GEFS. The GEFS is not the best performing medium range guidance (European ensemble), so there are certainly situations where the GEFS struggles and hence the related AI guidance could struggle accordingly. SPC forecasters now have access to the CSU-MLP for their forecasts, and can hopefully make adjustments based on knowledge of potential limitations to the machine learning such as this. Regardless, this is work where artificial intelligence/ machine learning has already made a major improvement to our community’s capacity to provide these types of outlooks, and I would expect as AI/ML techniques improve and the ability to utilize more model suites becomes possible, this guidance will only continue to improve.
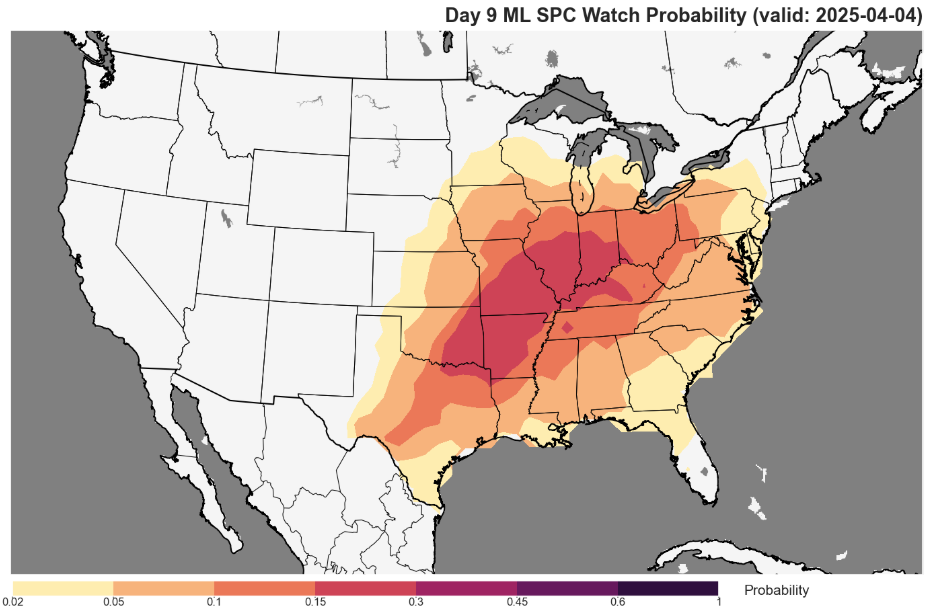
In the last few years, research scientists at the NOAA National Severe Storms Lab (NSSL) have been working with meteorologists at SPC to develop machine learning approaches not only for outlook guidance similar to the CSU-MLP, but also unique products like the one above, the probability of an SPC watch being issued at a given location. This particular graphic shows the current forecast for day 9, next Friday.
These forecasts are obviously still experimental, and will need to be examined and used over a period of time, not only to discern their accuracy but also their utility for forecasters and potential end users. In fact, for the first time this year, the NOAA Hazardous Weather Testbed is conducting an experiment involving NOAA scientists and academic researchers looking at outlooks for the week 2 period that will help evaluate the utility of some of these tools and other approaches for medium and long range severe weather forecasting.
As we get deeper into spring severe weather season, I will continue to highlight some of these tools and products to help me communicate severe weather risks. I invite you to ask any questions you may have about the various products and also share ways in which longer term severe weather outlooks might help you with some of your planning and decision making.
Reference Websites
SPC Severe Weather Climatology
Colorado State University Machine Learning Probabilities Page
Saint Louis University Cooperative Institute for Precipitation Systems (CIPS) Analog Page

Leave a comment