What do the seasonal outlooks say – and how you can stay on top of the threats
Today is June 1st which marks the “official” start of the hurricane season which will run until November 30th. While tropical storms and even a few hurricanes have happened outside of this period – particularly in May and December – June 1st through November 30th represents the period when the overwhelming bulk of tropical cyclone activity occurs in the Atlantic basin.
(A quick aside about the term “tropical cyclone.” Tropical cyclone (TC) is the generic term for any organized low pressure system of tropical origin. Tropical depressions are TCs with sustained winds less than 39 mph; tropical storms are TCs with sustained winds of at least 39 mph, once a storm has sustained winds of 74 mph or greater, it is called a hurricane in the Atlantic or eastern or central Pacific basins.)
A number of organizations, both private and public sector, produce outlooks of anticipated seasonal tropical cyclone activity. NOAA’s Climate Prediction Center (CPC) produces the official seasonal tropical outlook for the US Government each May. While CPC is the issuing entity for the outlook, it is produced in collaboration with scientists from the National Hurricane Center (NHC) and NOAA Research’s Atlantic Oceanographic and Marine Laboratory (AOML), the NOAA lab that does the bulk of the agency’s tropical meteorological research.
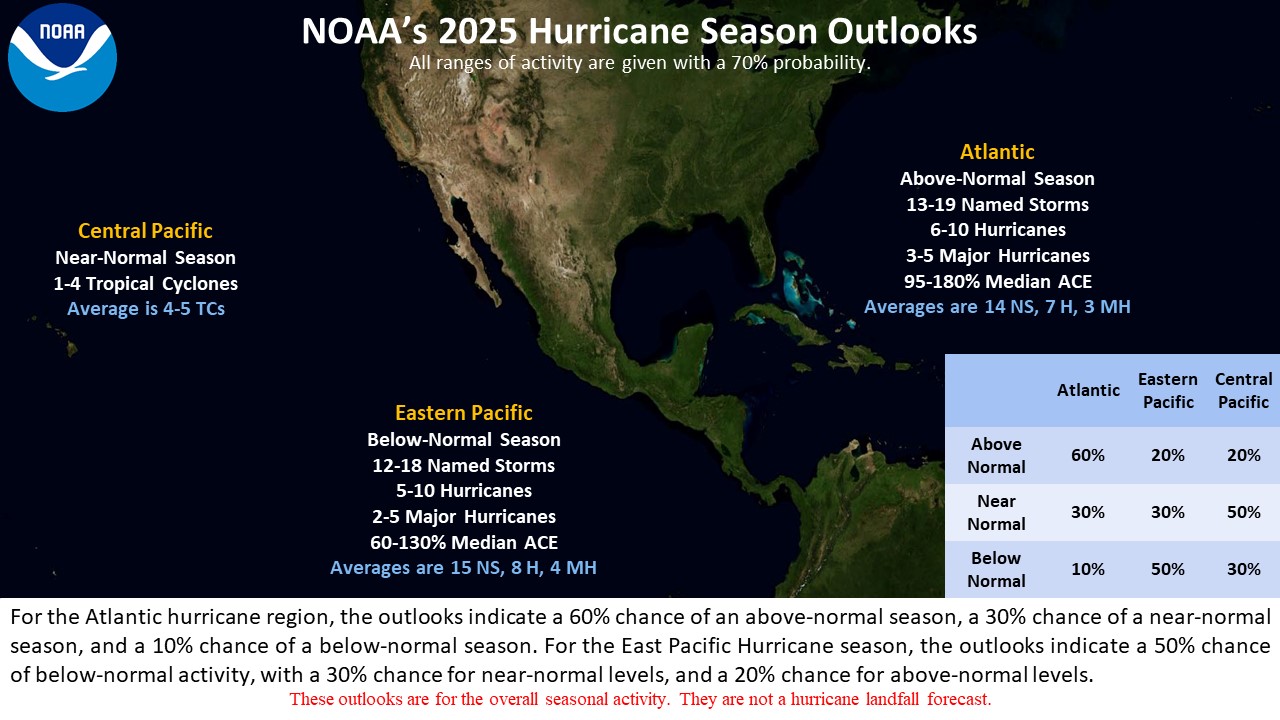
NOAA’s seasonal outlook also provides a forecast for the Eastern and Central Pacific basins. As shown above, CPC is forecasting that an above normal season is the most likely outcome in the Atlantic, while the East Pacific is forecast to be below normal, which is pretty typical when the Atlantic is above normal. The Central Pacific basin is much less active overall than the other two basins, and typically is only more active than normal during well defined El Nino events.
The phase of the El Nino Southern Oscillation (ENSO) also plays a significant role in the overall tropical activity of the other two basins, with La Nina favoring above normal activity in the Atlantic, and El Nino favoring the opposite. The primary reason for this is that upper level winds over the Caribbean and tropical Atlantic tend to be stronger and more from the west during El Nino, which leads to increased wind shear that tends to tear apart tropical cyclones. This wind shear is suppressed during La Nina.
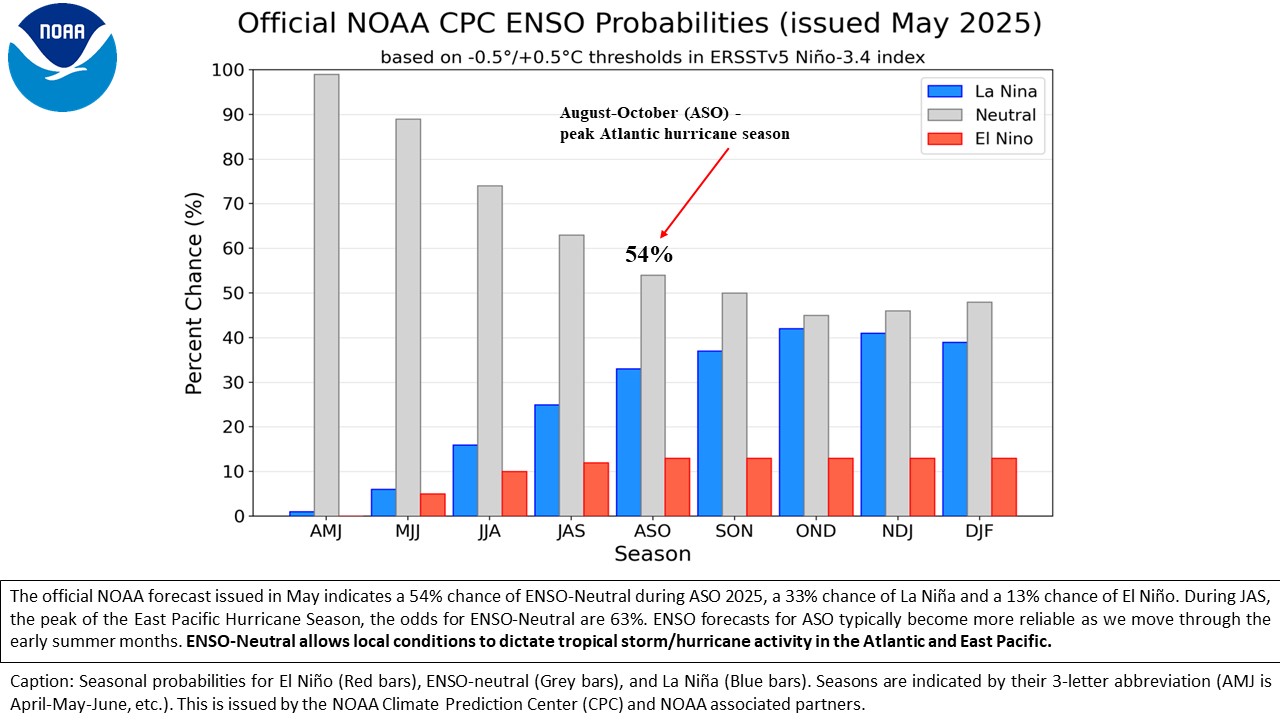
As we enter this hurricane season, ENSO is currently in a neutral (neither El Nino nor La Nina) phase, and is forecast to remain that way through the season. An important caveat – which is one of the big sources of uncertainty for seasonal hurricane outlooks – is that 6 month forecasts for ENSO phase tend to struggle most during the spring, so ENSO is an important seasonal factor that is monitored closely going through the season.

Other factors that help determine the amount of tropical cyclone activity in the Atlantic are primarily favorable for an above normal amount of activity. This includes sea surface temperatures (SST) being above normal. Warm water provides the primary fuel for tropical cyclone development and intensification, so warmer than normal SSTs favor more activity and more intense activity.

While SSTs in the tropical Atlantic are not at the record warm levels that were seen the last couple of years, they are still above normal and favor above normal activity.

Probably the other most well known seasonal hurricane outlook is the one done by the Tropical Cyclone Research and Forecasting team at Colorado State University. This scientific group was started in the 1980s by pioneering scientist Dr. William Gray, who led the initial groundbreaking research on seasonal hurricane forecasting. The team at CSU under Dr. Gray’s leadership started producing seasonal hurricane outlooks in 1984, and continues to do so today under the leadership of Dr. Philip Klotzbach. CSU’s 2025 outlook was issued on April 3rd, and is generally consistent with the outlook issued last week by CPC. CSU will update their outlook on June 11th.
Obviously, the amount of tropical cyclone activity in a given year does not tell an individual living along the coast whether or when their location might be impacted by a tropical cyclone. NOAA does not issue landfall probabilities with their seasonal outlook, stating (correctly) that where a storm tracks is governed by the ongoing weather pattern at the time the storm exists, and that this cannot be predicted more than several days in advance.

CSU does issue landfall probabilities with their outlooks, stating (also correctly) that the probability of landfall at a given location increases or decreases along with the overall activity in the basin, and particularly depending upon the amount of activity in the western (west of 60W) part of the Atlantic basin. The above table shows the CSU forecast probabilities for 2025. Of course, as meteorologists and emergency management officials stress, it only takes one hurricane in the wrong place to cause serious issues; so while the seasonal outlooks provide information that can be used to help plan, coastal residents and people with interests in locations vulnerable to impacts of tropical cyclones have to maintain vigilance through the season regardless of the seasonal outlook.
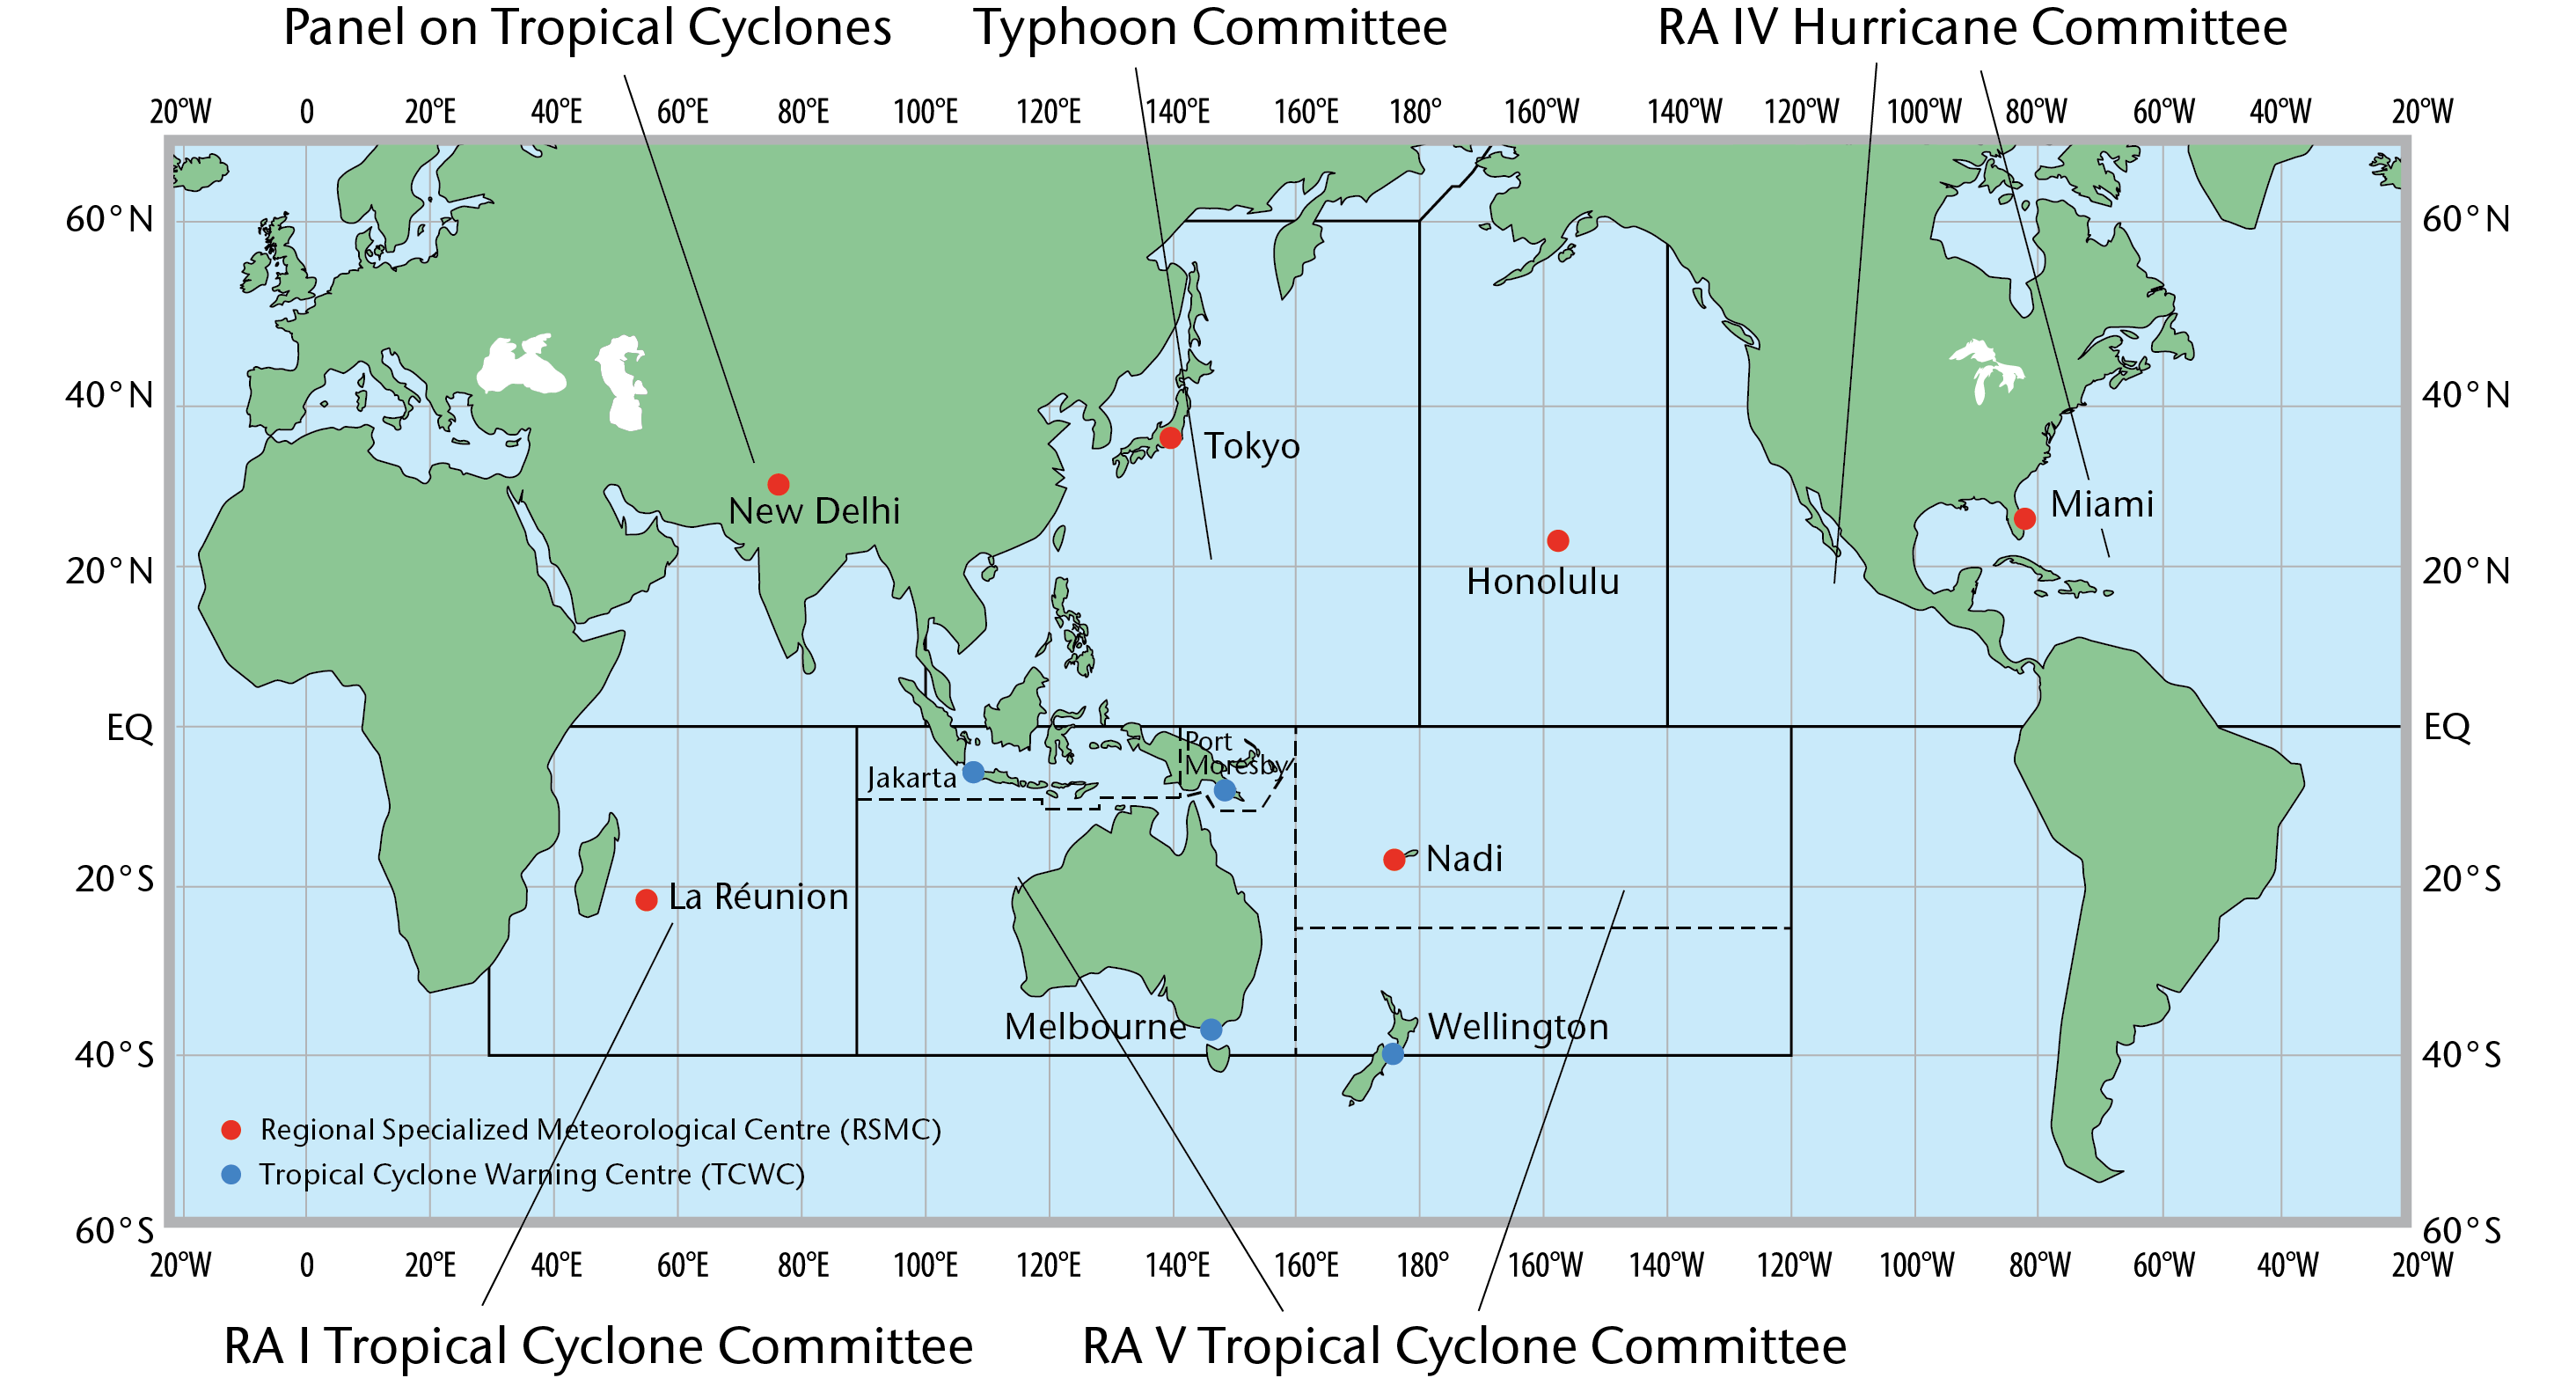
So how do we maintain that vigilance? Tropical cyclones are a global issue, with individual cyclones potentially impacting multiple countries. Because of this, the global forecast responsibilities are organized by the World Meteorological Organization. Regional Specialized Meteorological Centres (RSMC), which are operated by the resident national meteorological service, provide tropical cyclone forecast services for their given area of responsibility as shown in the map above.
For the Atlantic basin, NOAA’s National Hurricane Center (NHC) in Miami is the RSMC that provides all tropical cyclone forecasts for the region. Individual nations’ meteorological services are typically responsible for issuing appropriate tropical cyclone watches and warnings for their country based on the forecasts from and collaboration with NHC.
In the United States, NHC is responsible for issuing the long term watches and warnings. These include (from NOAA’s hurricane forecast information website):
A Hurricane Watch means hurricane conditions are possible somewhere within the watch area, with tropical-storm-force winds beginning within the next 48 hours. A Hurricane Warning means hurricane conditions are expected somewhere within the warning area, with tropical-storm-force winds beginning within 36 hours.
A Tropical Storm Watch means tropical storm conditions are possible within the next 48 hours, a Tropical Storm Warning means they are expected somewhere within the warning area.
A Storm Surge Watch means the possibility of life-threatening inundation generally within 48 hours, and a Storm Surge Warning means the danger of life-threatening inundation generally within 36 hours.
NHC issues a variety of products and outlooks to help the public stay aware and prepared for tropical cyclone threats. The basic product that NHC issues is the tropical weather outlook, a graphical product with a text discussion that identifies potential areas of tropical cyclone development over the next week along with the probability of formation. NHC routinely issues this product four times a day, at 2 am/pm and 8 am/pm EDT, with updates as needed.
Once a tropical cyclone develops, NHC issues forecasts and advisories for it four times per day. These include a five day forecast of the position and intensity of the system. Anytime there are active watches or warnings for a cyclone, NHC issues intermediate advisories at the mid-point between their regular advisories. NHC can also start forecasts and advisories on a system even before it is officially classified as a tropical cyclone if it presents a potential threat to land in the timeframe where watches and warnings could be needed.
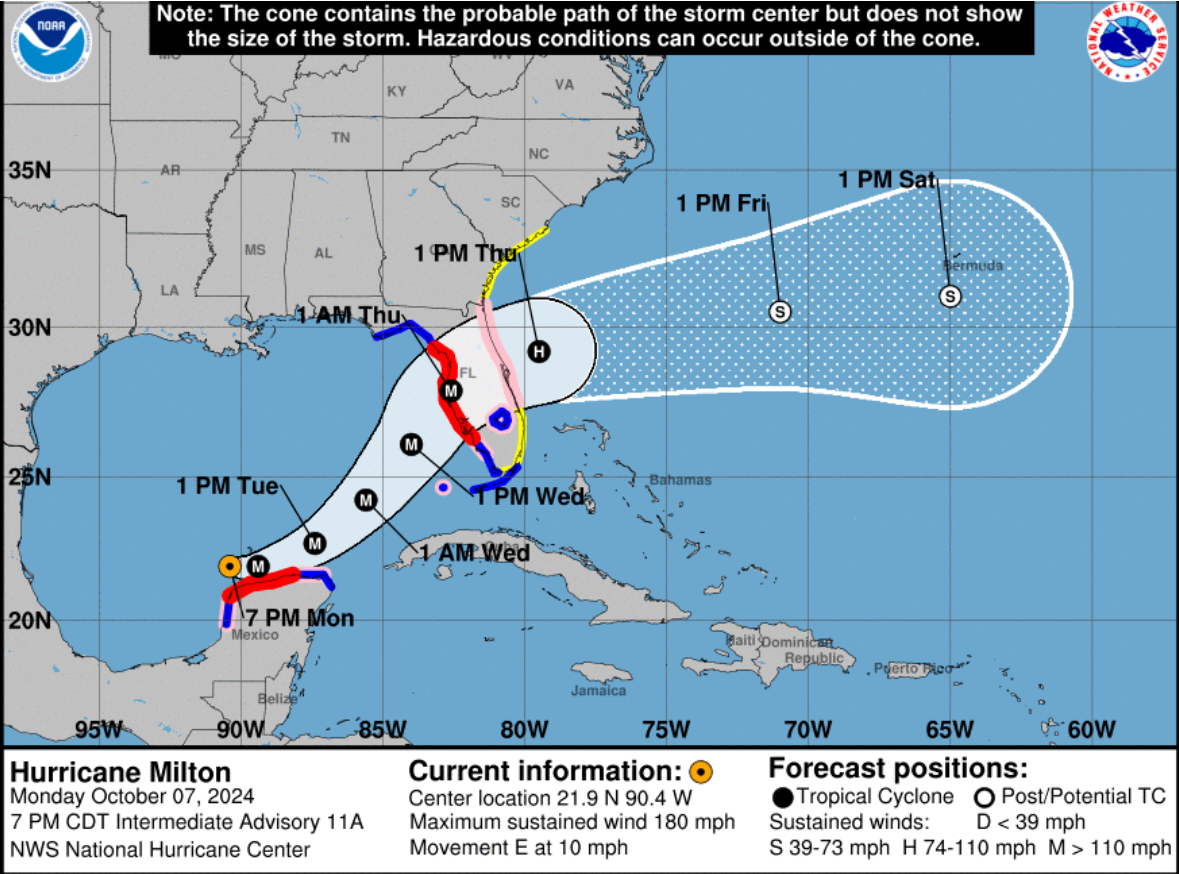
The NHC product that is likely most well known by the public is the ubiquitous “cone of uncertainty” product. This product shows the forecast positions for the center of the tropical cyclone, along with a “cone” which is meant to convey the potential uncertainty of the forecast. There are a few critical aspects to this product to understand. First, the cone represents the area where the center of the cyclone would be expected to track ~65% of the time based on the average error for the NHC forecast. In other words, it does not say anything about the uncertainty of the weather pattern, track or intensity for this five day period for this specific cyclone – it is based totally on historical averages. Additionally, since the cone is focused on the uncertainty of the track of the center, it does not really tell you much about the actual hazards associated with the tropical cyclone, which can extend literally hundreds of miles either side of the center. The note at the top of the graphic states it clearly:

NHC is responsible for the forecast of the tropical cyclone and its large scale hazards, but local NWS offices are responsible for forecasts and warnings for the localized, short term hazards associated with a tropical cyclone. This includes flash flood watches and warnings, extreme wind warnings, and tornado warnings. Tornado watches continue to be issued as they normally are by the NWS Storm Prediction Center (SPC).
Obviously, I have focused on the Atlantic basin here because that is where most of the direct tropical cyclone impacts come for the United States, but NHC issues the same products for the eastern Pacific, and the Central Pacific Hurricane Center in Honolulu issues the same products for the central Pacific. While landfall and direct impacts for the US are rare in these areas, they do occasionally happen and indirect impacts from rainfall are somewhat more common. People in Hawaii and the Southwest obviously do need to be aware of what is going on in their tropical areas during hurricane season.
As far as Balanced Weather is concerned, I am planning on coverage of the tropics being an important part of this Substack. I will be doing a newsletter that will provide a deep dive on the tropics at least once a week, typically on Mondays. Obviously, I will be talking in the daily newsletter about any specific threats or areas of interest. Once a system becomes a threat, in addition to the information in the newsletters, I plan to provide additional in-depth information for paid subscribers using live video and chat. This will include detailed forecast briefings talking about the specific meteorological situation and potential uncertainties for a system, live “play-by-play” of key aircraft reconnaissance missions and/or model runs as data comes in, and chat and video livestreams during and after landfall. If you would be interested in some of the more in-depth information I provide paid subscribers – or just want to support Balanced Weather – you can join now with a special hurricane season kickoff special.
In the coming weeks, I will also be doing additional posts and videos about some of the physical and social science of hurricane forecasting, warnings and communication. This will include talking about some of current and experimental products and services from NHC that go beyond the cone product I talked about above. If you have specific topics you would be interested in learning more about, please post comments or questions below (comments are open to all subscribers on this post).

Leave a comment