A reference as we head into the peak of Atlantic hurricane season
Aug 16, 2025
As we reach August 15th, we are really hitting what can be seen as the peak 8 to 10 week stretch of Atlantic hurricane season that runs from mid-August to late October. To hopefully help folks better interpret forecasts (and my posts) during this critical period, I’ve put together what I hope can be a kind of reference document for you to understand some of the terminology and modeling associated with hurricane forecasting. This is meant to be a post that I will update as I get questions or realize that I am missing an answer to a question that many people have — so please feel free to post questions (or clarifications!) I am going to start off with an overview of tropical cyclones and how forecasting for these storms is done globally (recycling some material from my opening of hurricane season post) and then get into some specifics about the US forecasting programs and the ways in which hurricanes are analyzed and forecast. None of this is going to be a deep dive as I am going to try to cover a lot of ground – hopefully I will get an opportunity to do some deeper dives into some of these specific topics either in posts or videos later in the season.
Tropical cyclones – a global issue
Tropical cyclone (TC) is the generic term for any organized low pressure system of tropical origin that has sufficient thunderstorm activity associated with it. Tropical depressions are TCs with sustained winds less than 39 mph; tropical storms are TCs with sustained winds of at least 39 mph; once a storm has sustained winds of 74 mph or greater, it is called a hurricane in the Atlantic or eastern or central Pacific basins. (In the northwestern Pacific it is called a typhoon. In the Indian and southwest Pacific oceans tropical cyclones are simply called tropical cyclones or “cyclones,” though to make things more confusing once a cyclone becomes strong enough in the Indian Ocean it is referred to by the Indian Meteorological Department as a “severe cyclonic storm” or an “extremely severe cyclonic storm.”)

Global tropical cyclone forecast responsibilities are organized by the World Meteorological Organization (WMO). WMO Regional Specialized Meteorological Centres (RSMC), which are operated by the resident national meteorological service, provide tropical cyclone forecast services for their given area of responsibility as shown in the map above.
NOAA’s National Hurricane Center (NHC) in Miami is the RSMC that provides tropical cyclone forecasts for most of the RA IV region, i.e., the Atlantic and the eastern Pacific oceans. Individual nations’ meteorological services are typically responsible for issuing appropriate tropical cyclone watches and warnings for their country based on the forecasts from and collaboration with NHC. Central Pacific tropical cyclone forecasts are provided by the National Weather Service office in Honolulu as the Central Pacific Hurricane Center (CPHC).
US Tropical Cyclone Forecasts and Warnings
In the United States, NHC (or CPHC in the central Pacific) is responsible for issuing tropical cyclone specific watches and warnings. These include (from NOAA’s hurricane forecast information website):
- A Hurricane Watch means hurricane conditions are possible somewhere within the watch area, with tropical-storm-force winds beginning within the next 48 hours. A Hurricane Warning means hurricane conditions are expected somewhere within the warning area, with tropical-storm-force winds beginning within 36 hours.
- A Tropical Storm Watch means tropical storm conditions are possible within the next 48 hours, a Tropical Storm Warning means they are expected somewhere within the warning area.
- A Storm Surge Watch means the possibility of life-threatening inundation generally within 48 hours, and a Storm Surge Warning means the danger of life-threatening inundation generally within 36 hours.
NHC issues a variety of products and outlooks to help the public stay aware and prepared for tropical cyclone threats. The basic daily forecast product that NHC issues is the tropical weather outlook, a graphical product with a text discussion that identifies potential areas of tropical cyclone development over the next week along with the probability of formation. NHC routinely issues this product four times a day, at 2 am/pm and 8 am/pm EDT, with updates as needed.
Once a tropical cyclone develops, NHC issues routine forecasts and advisory packages for it four times per day. These packages include text public and forecast (marine)st advisories; the forecast advisory gives a five day forecast of the position and intensity of the system. Anytime there are active watches or warnings for a cyclone, NHC issues intermediate public advisories at the mid-point between their regular advisories, with even more frequent updates for landfalling systems. NHC can also start forecasts and advisories on a system even before it is officially classified as a tropical cyclone if it presents a potential threat to land in the timeframe where watches and warnings could be needed. In this situation the system is referred to as a potential tropical cyclone (PTC) along with the next number of tropical cyclone, (e.g., if “pre-advisories” are needed for the next system after Erin, it would be PTC 6 as there have been five Atlantic tropical cyclones so far).

NHC obviously issues a number of graphical forecast products as well. The NHC product that is likely most well known by the public is the ubiquitous “cone of uncertainty” product. This product shows the forecast positions for the center of the tropical cyclone, along with a “cone” which is meant to convey the potential uncertainty of the forecast. There are a few critical aspects to this product to understand. First, the cone represents the area where the center of the cyclone would be expected to track ~65% of the time based on the average error for the NHC forecast. In other words, it does not say anything about the uncertainty of the weather pattern, track or intensity for this five day period for this specific cyclone – it is based totally on historical averages. Additionally, since the cone is focused on the uncertainty of the track of the center, it does not really tell you much about the actual hazards associated with the tropical cyclone, which can extend literally hundreds of miles either side of the center. The note at the top of the graphic states it clearly:

Along with the text advisories, NHC also issues a tropical cyclone discussion with each forecast package, in which the forecaster gives their technical evaluation of the TC’s current evolution and their forecast rationale.
![[Key Messages]](https://substackcdn.com/image/fetch/$s_!gboc!,f_auto,q_auto:good,fl_progressive:steep/https%3A%2F%2Fsubstack-post-media.s3.amazonaws.com%2Fpublic%2Fimages%2F700a60fb-53b5-48d7-981b-897ed9ed48ab_897x736.png "[Key Messages]")
Another really useful product that NHC has been issuing for the last several years is the “key messages” graphic. This combines text bullets outlining the most important messages the NHC wants to communicate about the storm, as well as a couple of key graphical forecasts.
NHC is responsible for the forecast of the tropical cyclone and its large scale hazards, but local NWS offices are responsible for forecasts and warnings for the localized, short term hazards associated with a tropical cyclone. This includes flash flood watches and warnings, extreme wind warnings, and tornado warnings. Tornado watches continue to be issued as they normally are by the NWS Storm Prediction Center (SPC).
Analyzing and Forecasting Tropical Cyclones
Meteorologists use the same basic tools to analyze and forecast tropical cyclones, particularly at the early stage before a system develops into a TC. These include observations (satellite, upper air, radar) and forecast models. As discussed above, NHC provides their forecast perspective on systems that have not yet obtained tropical cyclone status in the tropical weather outlook. Once a tropical disturbance has obtained enough organization that NHC feels it is trackable and has some potential for development, they will designate it as an “Invest” and it will be assigned a number sequentially between 90 and 99. Invests in the Atlantic have an “L” and the end and in the eastern Pacific have an “E,” i.e., Invest 98L or Invest 98E.
Once a system is declared an Invest, it means that NHC provides an estimated center location and intensity every 6 hours. This enables the weather community to do things like provide web pages with model and satellite data focused on the Invest. It also means that the NWS Environmental Modeling Center (EMC) will start producing hurricane specific model forecasts for the Invest.
EMC runs four hurricane specific models. From oldest to newest they are: HWRF (Hurricane Weather Research Forecast) model, Hurricanes in a Multi-scale Ocean-coupled Non-hydrostatic model (HMON), and two versions of the Hurricane Analysis and Forecast System (HAFS) models, HAFS-A and HAFS-B. All of these models are high resolution, physics based models specifically developed with the goal of producing accurate track and intensity forecasts for tropical cyclones. Each of these models is run operationally four times a day for each invest and tropical cyclone.
Along with these models, NHC uses all of the available high quality global models used by meteorologists for daily weather forecasting: the European Centre for Medium Range Weather Forecasting (ECMWF), the American global model (GFS), the UK Met Office model (UKMET or UKMO), and the Canadian global model (GEPS or CMC). All of these modeling systems have ensemble systems, which are modeling systems where the initial conditions at the start of a model run are given minor perturbations to try to capture potential error in the observations. This then provides alternative forecasts – ensemble members – which meteorologists use to gauge the potential uncertainty in a forecast and possible reasonable alternate forecast scenarios.
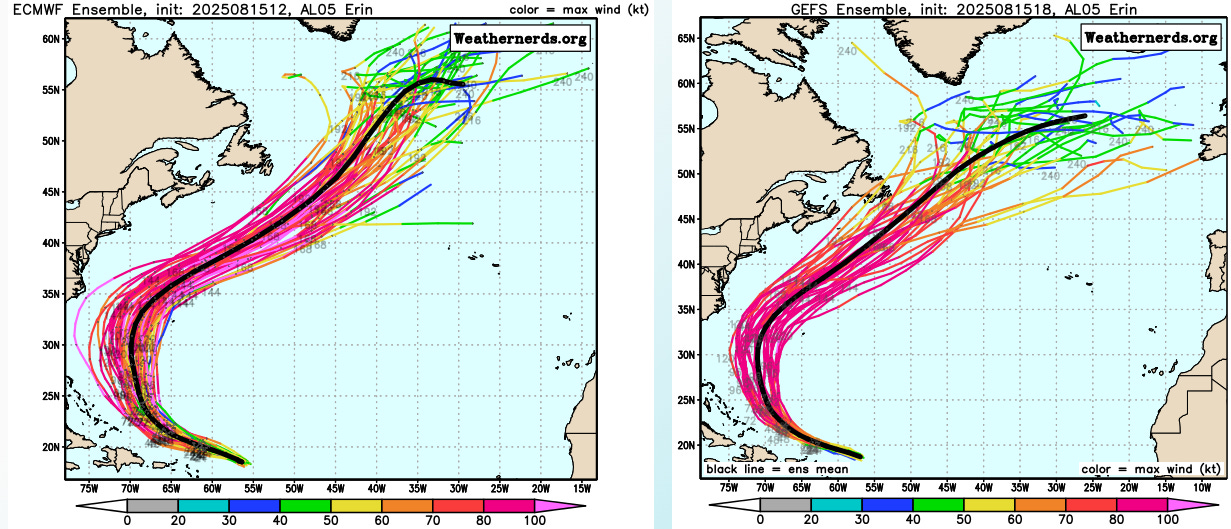
This is an example of the August 15th 1200 UTC morning ensemble runs from the ECMWF and GFS ensembles for Hurricane Erin. Each of these ensemble model systems runs four times per day, so between the hurricane specific models, the global ensembles, and other less utilized global models (e.g., German ICON) and older statistical hurricane models, there are literally hundreds of model forecasts produced every day for each invest and tropical cyclone. This is not even taking into account newer artificial intelligence models which appear to have some skill at hurricane forecasting, particularly the Google AI Deepmind system which is being developed in partnership with NHC (and which NHC discusses as part of their forecast process in tropical cyclone discussions).
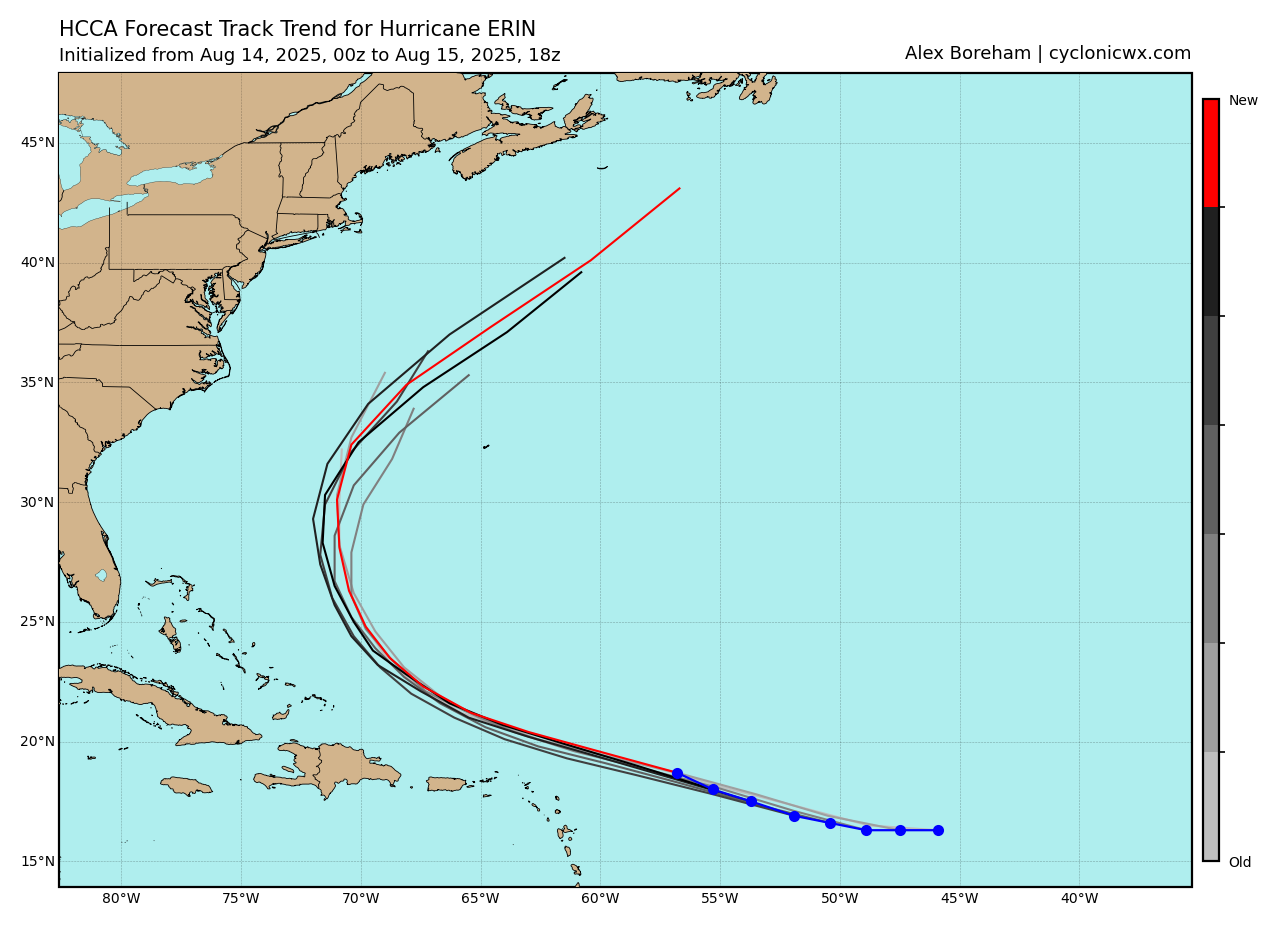
In order to try to synthesize all of this model guidance, NHC utilizes consensus and superensembles, where the various models are combined and averaged to provide multiple model “consensus” forecasts of track and intensity. The above example shows the last several cycles of the Hurricane Forecast Improvement Corrected Consensus Approach (HCCA) consensus model, an in-house tool that blends models with various weighting techniques and which has emerged as one of the most accurate track forecast tools for NHC.
I have primarily focused on the track forecasts so far, but obviously all of these models produce intensity forecasts — and NHC of course has to produce an intensity forecast. While hurricane track forecasts are a challenge, intensity forecasts are even more so and improvement in these forecasts has tended to lag track forecast improvements. However, recent years have seen significant improvements to the intensity forecasts, primarily through enhancements to the hurricane specific models. Global models generally cannot directly capture the often rapid changes in tropical cyclones, which are smaller scale phenomena than the large scale weather systems global models are designed to forecast. Still, global models definitely can show overall intensity trends in tropical cyclones and are critical for evaluating the large scale atmospheric environment the tropical cyclone will be in.
Once NHC generates their 7-day track and intensity forecast, probabilistic impact graphics are generated based on that forecast, including:
![[Image of probabilities of 34-kt winds]](https://substackcdn.com/image/fetch/$s_!EceG!,f_auto,q_auto:good,fl_progressive:steep/https%3A%2F%2Fsubstack-post-media.s3.amazonaws.com%2Fpublic%2Fimages%2Fb2c926b2-ac9e-4aa8-83b6-124da005d819_897x738.png "[Image of probabilities of 34-kt winds]")
Probabilities of tropical storm force, 50 knot and hurricane force winds;

Earliest reasonable arrival time of tropical storm force winds; and probabilistic storm surge graphics.
Aircraft Reconnaissance
The United States performs aircraft reconnaissance on tropical disturbances and cyclones within its area of forecast responsibility using planes and personnel from the US Air Force and NOAA. While the primary focus is on systems that have some threat of impacting the United States and its territories, reconnaissance flights are typically performed at some level on any hurricane that is a threat to land. Airborne reconnaissance cannot be performed until a tropical system has moved far enough west to be within reasonable range of aircraft, which can depart from bases as far east as the eastern Caribbean. Aircraft are equipped with various sensors (including radar) and the capacity to launch dropsondes, instruments that descend from the plane and take measurements in the same manner as a radiosonde attached to a weather balloon.
The specifics of a reconnaissance mission depend on a number of factors. For weaker systems where the aircraft is trying to determine if a low level circulation, the plane often flies low in the atmosphere (1,500 to 5,000 ft AGL) ; for established tropical storms and hurricanes, the plane flies a specific pattern repeatedly at around 700 millibars (~12K AGL) to gather data needed by NHC to determine the precise location, intensity, wind field and structure of the hurricane. For systems that are a significant threat to the US, dropsonde missions are performed where a plane flies a pattern around the tropical cyclone releasing dropsondes to gather data utilized to improve model forecasts of the system.
Data that is collected by the aircraft instrumentation is sent back to NHC. The data is sent in coded text products; a number of websites decode and display the data in real-time. The data text product that is probably most utilized in its “raw” form is the Vortex Data Message (VDM), which is sent by the plane after each pass through the center of the storm; it provides a summary of critical data such as the center location, estimated or measured central pressure, strongest wind observed by the plane, and other data. NHC also issues a daily reconnaissance Plan of the Day (POD) which provides the anticipated mission schedule for each day (decoding info here).
Select Websites
I have linked to some of the key websites I use for tropical data and will list some others here. There are many really good ones, so this is by no means exhaustive:
National Hurricane Center (duh)
Tomer Burg’s Real Time Tropical Cyclones (Tomer is getting ready to change this page)

Leave a comment