Testing and evaluating new tools and model guidance to better forecast winter storms
May 08, 2026
One of the most exciting aspects of my position when I worked at the National Severe Storms Laboratory was working with NOAA Testbeds. NOAA operates testbeds and proving grounds that serve as facilities where experimental forecast guidance, techniques and products can be tested by conducting experiments in a realistic but controlled quasi-operational environment. This enables research and development to be vetted in a realistic test before being moved to an operational setting.
NOAA Testbeds really began when the National Weather Service Storm Prediction Center — the entity responsible for severe thunderstorm and fire weather forecasting for the United States — moved from its original home in Kansas City to Norman, OK in 1997. A major reason for this move was to have SPC collocated with the National Severe Storms Laboratory to better facilitate the transition of NOAA’s severe weather research to operations. As part of this new paradigm, forecasters at SPC and research scientists at NSSL and the University of Oklahoma began working together to evaluate new forecast tools, which eventually grew into the more formalized Spring Forecasting Experiment (SFE) within an entity known as the Hazardous Weather Testbed (HWT).
Over the years, experimental warning techniques as well as social science experiments would be added to the HWT, and this testbed became a model for successful transfers of research-to-operations that other NOAA weather and science programs wished to emulate. That initial seed of the HWT grew over the next two decades to encompass 13 testbeds and proving grounds that span the full expanse of NOAA operational science from climate to oceans to weather.
One of these 13 testbeds is the NOAA Hydrometeorology Testbed (HMT), a “joint OAR—NWS testbed motivated to make communities that are more resilient to the impacts of extreme precipitation on lives, property, water supply and ecosystems. HMT is co-managed by the Physical Sciences Laboratory and the NWS Weather Prediction Center in partnership with the National Water Center.” As with the HWT, the HMT conducts several experiments throughout the year, focused on the Weather Prediction Center (WPC) mission areas of winter weather and heavy rain/flash flooding.
Back in the pre-COVID days, most testbeds conducted their experiments in person at the testbed facility, but the COVID period necessitated a move to virtual experiments and in recent years some experiments continue to be done virtually, partially to allow for greater participation from remote NOAA offices. I was lucky enough in March to participate on a couple of days of a virtual week of the annual HMT Winter Weather Experiment (WWE). Per the HMT webpage, the WWE began in 2011 to “bring together members of the operational forecasting, research, and academic communities to address winter weather forecast challenges. Previous experiments have focused on exploring the utility of high-resolution models, model implicit snowfall forecasting techniques to improve both deterministic and probabilistic snow and ice forecasts in the Day 1-7 time frame.”
I was able to participate on Tuesday and Wednesday of the experiment. The experiment consisted of several meteorologists from the National Weather Service as well as the Department of Defense working on producing a variety of winter weather forecasts for historic winter weather events using a variety of new tools and techniques from operational and ensemble weather models.
Tuesday morning started off with the meteorologists reviewing their forecasts for the event they worked Monday afternoon. After the event review, we jumped into the forecast for the next event. The experiment coordinators do not reveal up front when the event is from to try to minimize the participating meteorologists the participating meteorologists being biased by potential experience with the event. The domain that we were looking at for this event was the northeast quarter of the country. Along with forecasting winter precipitation amounts, each forecaster was assigned three specific locations to produce timing and impact forecasts based around the WPC Winter Storm Severity Index. Timing and impact forecasts have become increasingly important as the NWS focuses more on decision support services for core partners like emergency managers.
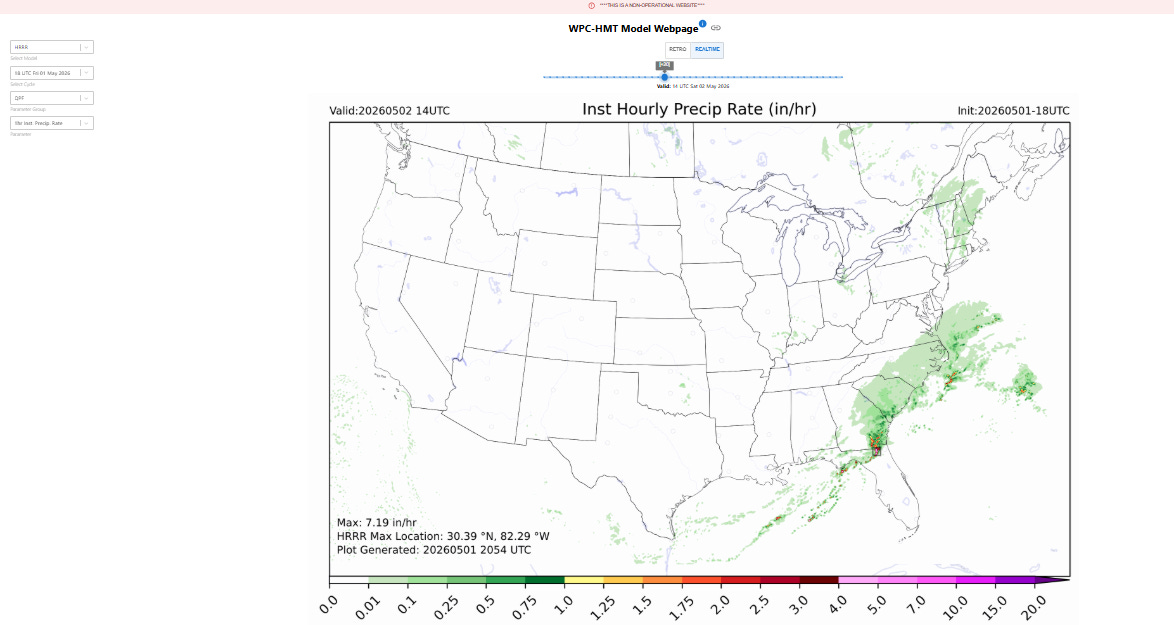
As I perused the data that we had access to for this event, it became pretty clear that this was going to be primarily a heavy snow forecast, as the focus was on an intense surface low pressure system developing off the Southeast coast and moving northeast along Eastern Seaboard.
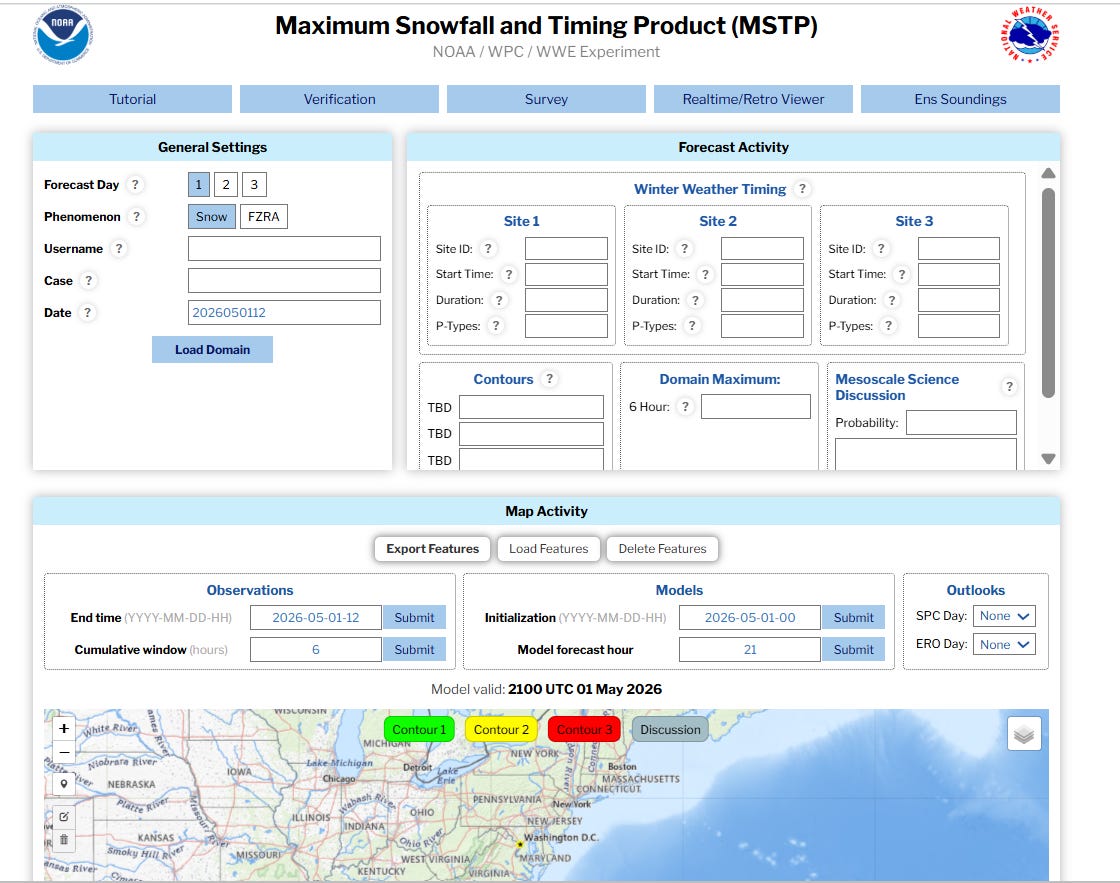
I was able to view the data using a variety of experimental visualization tools that were very useful, and to generate snowfall forecasts using drawing tools specifically designed for this experiment. We generated an initial set of forecasts at a 48 to 72 hour timeframe, and then refined those forecasts for the 24 to 48 hour lead time.
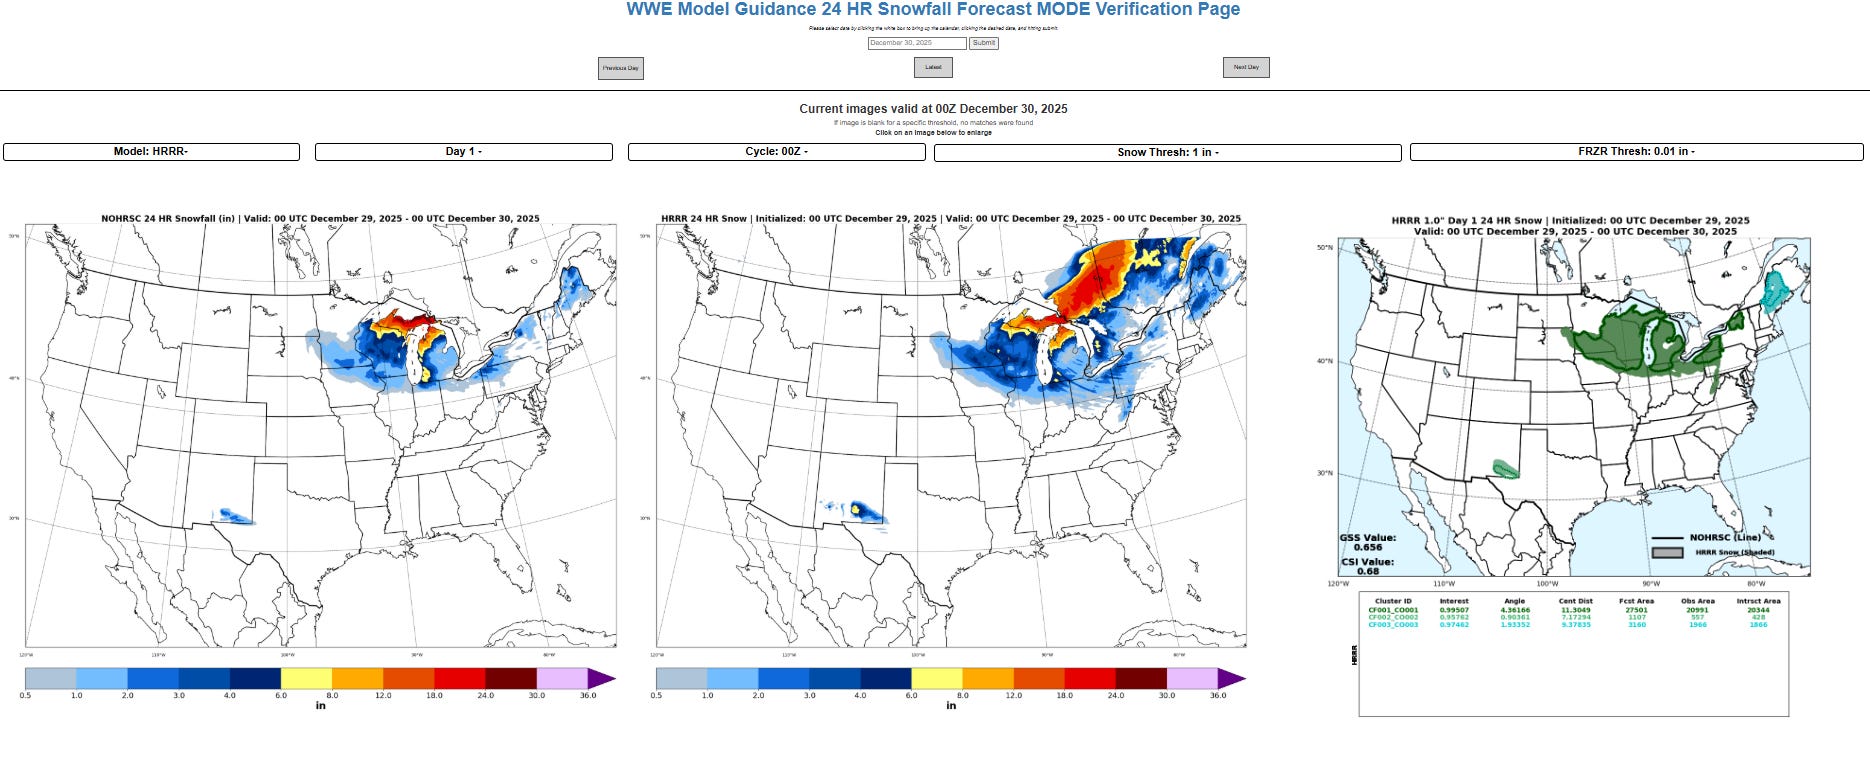
After the forecast aspect of the event, we then spent several hours doing an analysis of our forecasts using specially designed analysis and visualization tools for the experiment. The event that we forecast was actually the February 22-24, 2026 blizzard that impacted the East Coast with feet of snow, including the historic record 3+ feet of snow at Providence, RI (one of my forecast sites, lol). It was exciting seeing the potential application of new forecast tools and processes to such an impactful winter storm.
One of the key aspects of testbed experiments is the surveys that forecasters complete as part of these experiments. These surveys ask the forecasters their opinions on the accuracy and utility of the tools and model guidance being evaluated as part of the experiment, and are a key way for the scientists managing the experiment to evaluate if the tools being evaluated in the experiment will have actual utility in the operational forecasting environment.
Being able to participate for a couple of days in the WWE was a great experience that reinforced to me the quality of science that NOAA produces. The scientists overseeing this experiment — Massey Bartolini, James Correia and Sarah Trojniak — are incredibly talented and dedicated scientists who take the responsibility of improving winter weather forecasts for the country very seriously. NOAA Testbeds are an important way in which the agency ensures that only quality science and technology end up being utilized in the production of operational forecasts and warnings.
Many NOAA testbed experiments today now also actual evaluate new forecast and warning products with core NWS partners such as emergency managers and broadcast meteorologists, enabling NOAA physical and social scientists to evaluate the utility of these products to end users. These efforts demonstrate the lengths NOAA goes to ensure the quality of its services — and serve as a reminder of the importance of providing these efforts with adequate resources if we expect to continue to have high quality weather and water forecasts and warnings.

Leave a comment